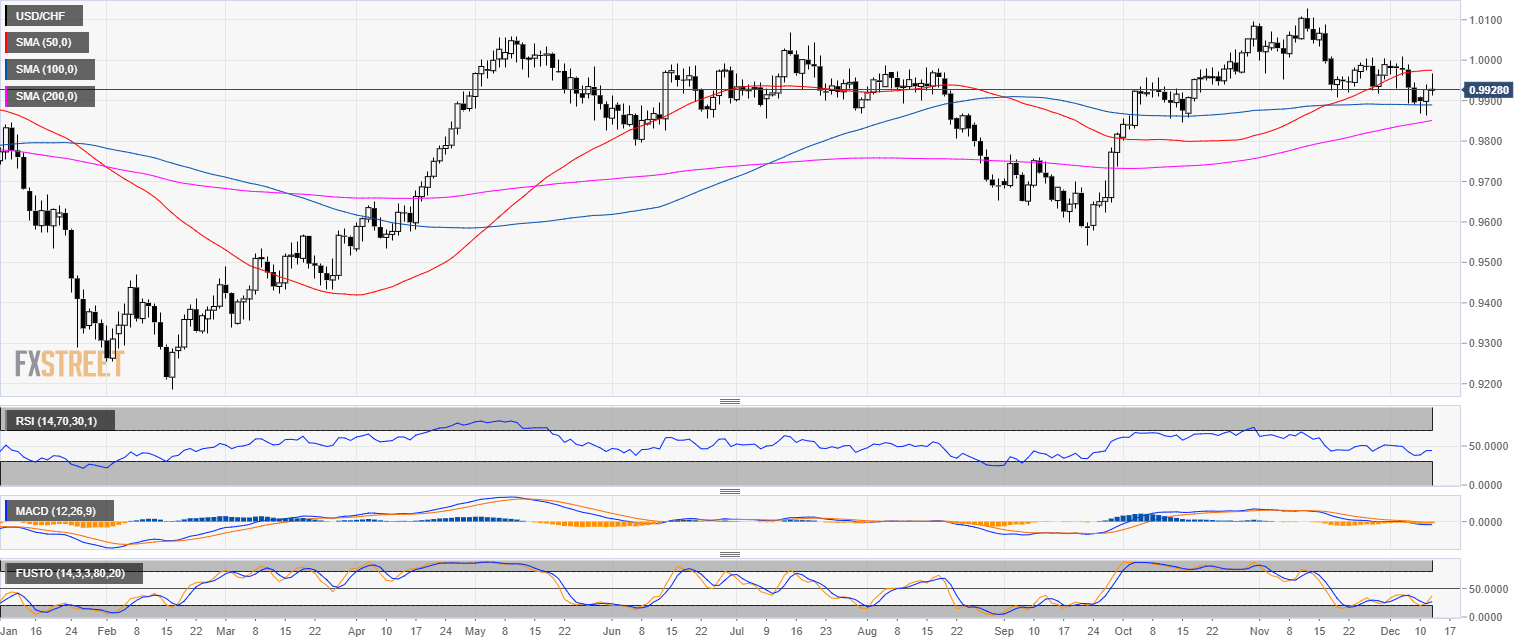
USD/CHF daily chart
- USD/CHF is trading in a bull trend above the 200-day simple moving average (SMA).
- USD/CHF rejected the 50 SMA this Wednesday.
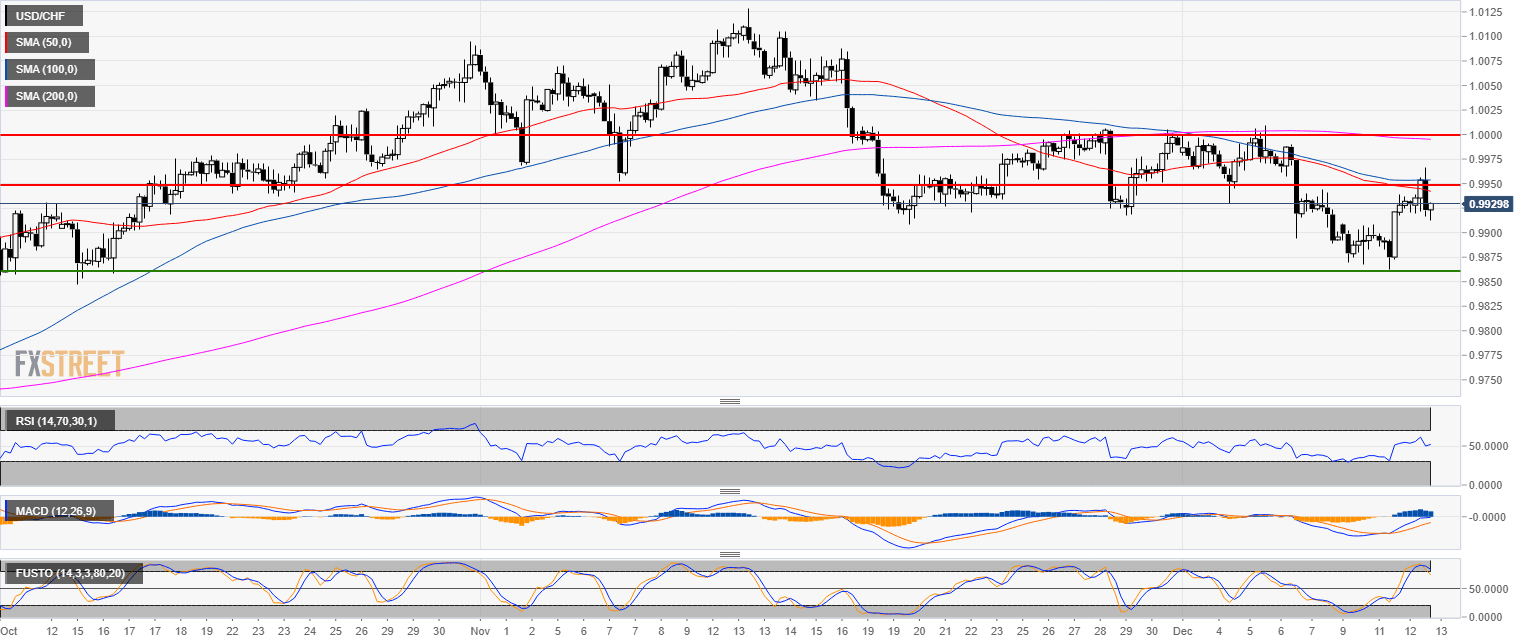
USD/CHF 4-hour chart
- Bulls are ultimately targeting the parity level but 0.9960 resistance must be cleared first.
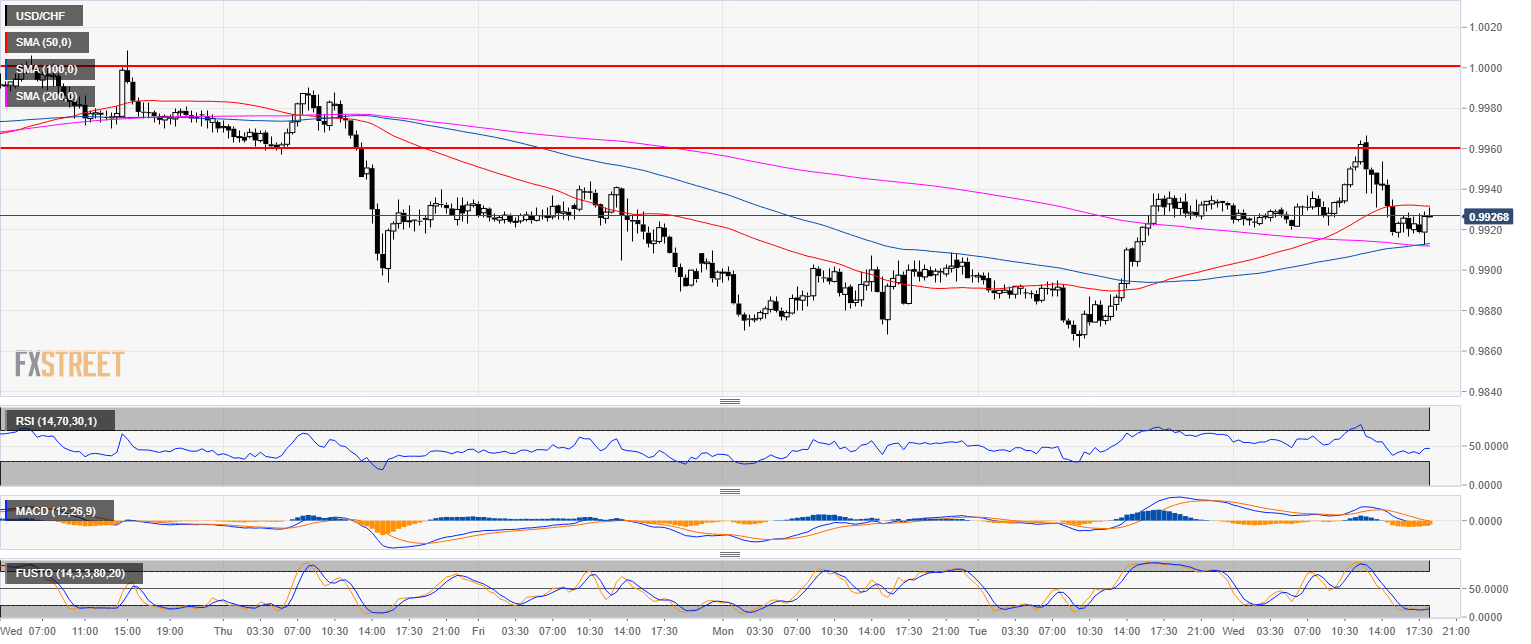
USD/CHF 30-minute chart
- USD/CHF bulls found support at the 100 and 200 SMA.
- Buyers will likely try to get reach the 0.9960 level.
Additional key levels
USD/CHF
Overview:
Today Last Price: 0.9926
Today Daily change: -1.0 pips
Today Daily change %: -0.0101%
Today Daily Open: 0.9927
Trends:
Previous Daily SMA20: 0.9967
Previous Daily SMA50: 0.9975
Previous Daily SMA100: 0.989
Previous Daily SMA200: 0.9845
Levels:
Previous Daily High: 0.9939
Previous Daily Low: 0.9862
Previous Weekly High: 1.0009
Previous Weekly Low: 0.9889
Previous Monthly High: 1.0129
Previous Monthly Low: 0.9908
Previous Daily Fibonacci 38.2%: 0.991
Previous Daily Fibonacci 61.8%: 0.9891
Previous Daily Pivot Point S1: 0.988
Previous Daily Pivot Point S2: 0.9832
Previous Daily Pivot Point S3: 0.9803
Previous Daily Pivot Point R1: 0.9957
Previous Daily Pivot Point R2: 0.9986
Previous Daily Pivot Point R3: 1.0034
