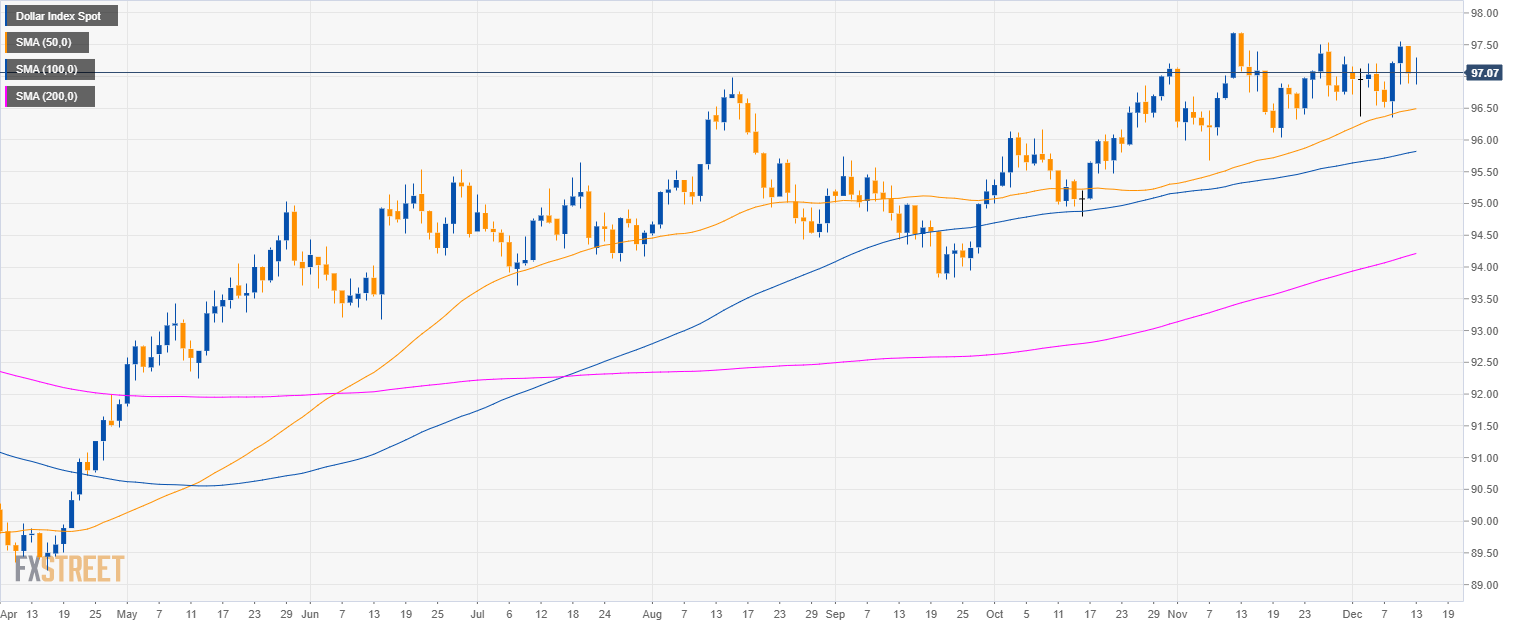
DXY daily chart
- The US Dollar Index (DXY) is trading in a bull trend above the 200-period simple moving average (SMA).
- DXY printed a small doji bar this Thursday, hardly a strong bullish continuation pattern.
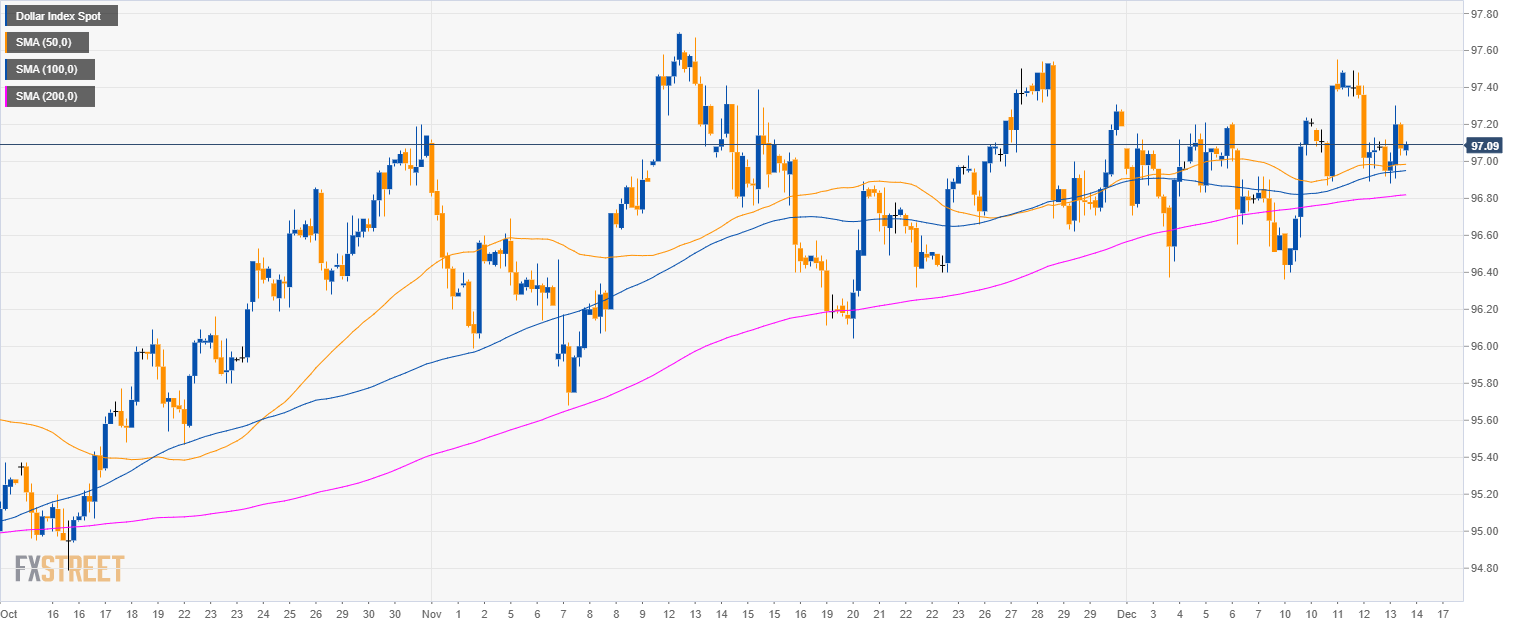
DXY 4-hour chart
- DXY is maintaining the price above the 97.00 level and the 50, 100 and 200 SMAs.
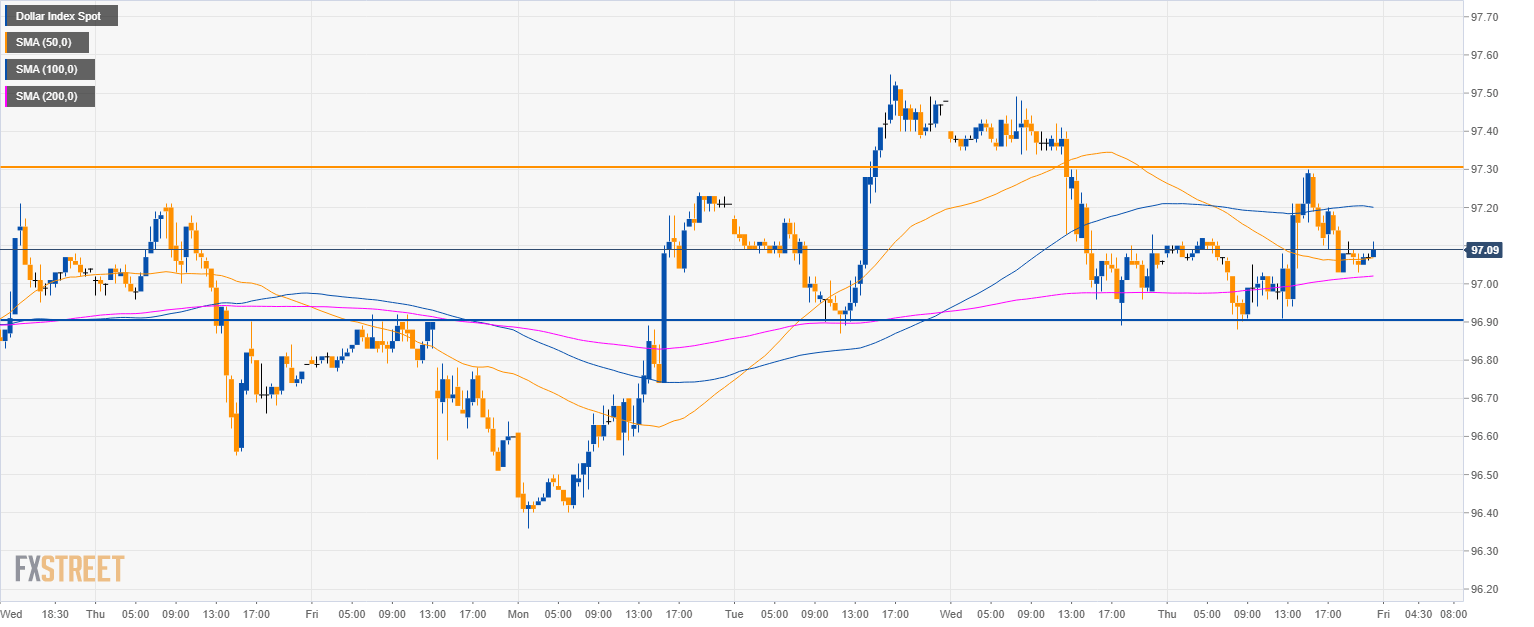
DXY 30-minute chart
- DXY is trapped in a range between the 96.90 and 97.30 levels.
- Bears have a slight advantage as 96.90 can be the next target.
Additional key resistance
Dollar Index Spot
Overview:
Today Last Price: 97.09
Today Daily change: 4.0 pips
Today Daily change %: 0.0412%
Today Daily Open: 97.05
Trends:
Previous Daily SMA20: 96.9
Previous Daily SMA50: 96.47
Previous Daily SMA100: 95.8
Previous Daily SMA200: 94.18
Levels:
Previous Daily High: 97.49
Previous Daily Low: 96.89
Previous Weekly High: 97.21
Previous Weekly Low: 96.37
Previous Monthly High: 97.7
Previous Monthly Low: 95.68
Previous Daily Fibonacci 38.2%: 97.12
Previous Daily Fibonacci 61.8%: 97.26
Previous Daily Pivot Point S1: 96.8
Previous Daily Pivot Point S2: 96.54
Previous Daily Pivot Point S3: 96.2
Previous Daily Pivot Point R1: 97.4
Previous Daily Pivot Point R2: 97.74
Previous Daily Pivot Point R3: 98
