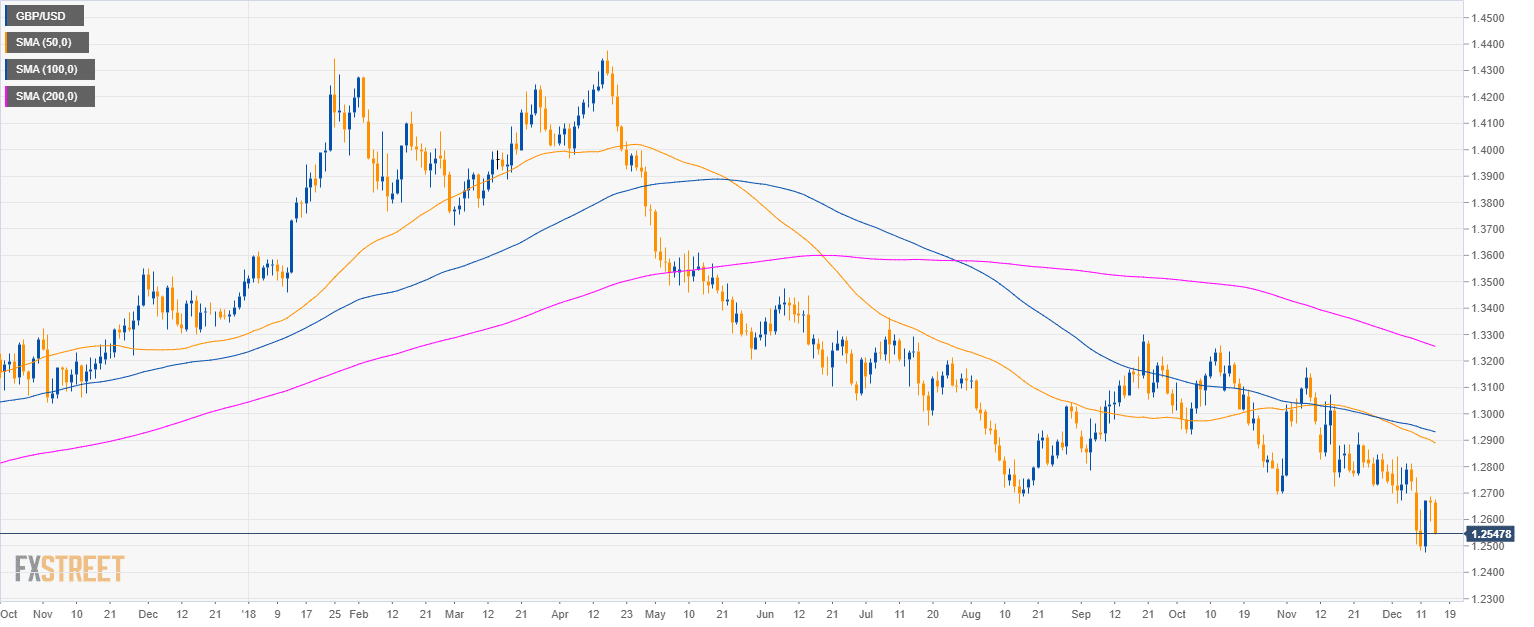
GBP/USD daily chart
- GBP/USD is trading in a bear trend below the 50, 100 and 200-day simple moving averages.
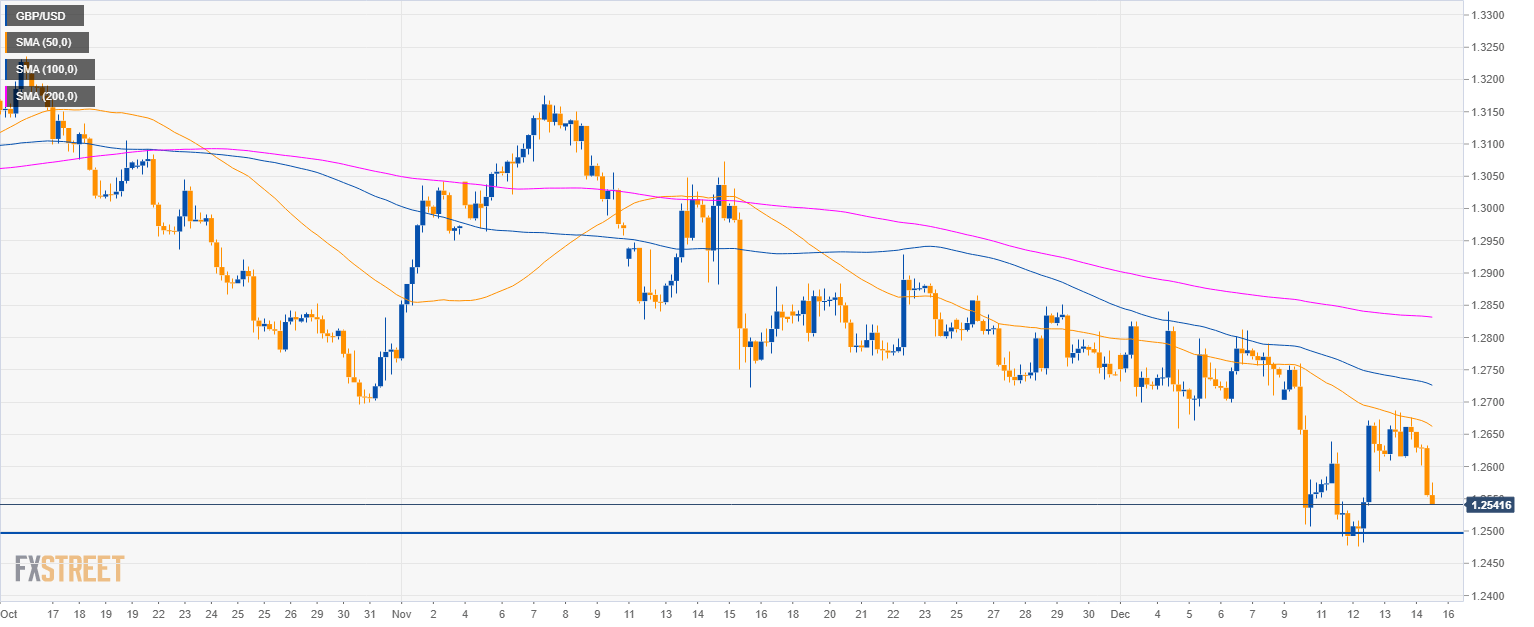
GBP/USD 4-hour chart
- GBP/USD is en route towards 1.2500 figure.
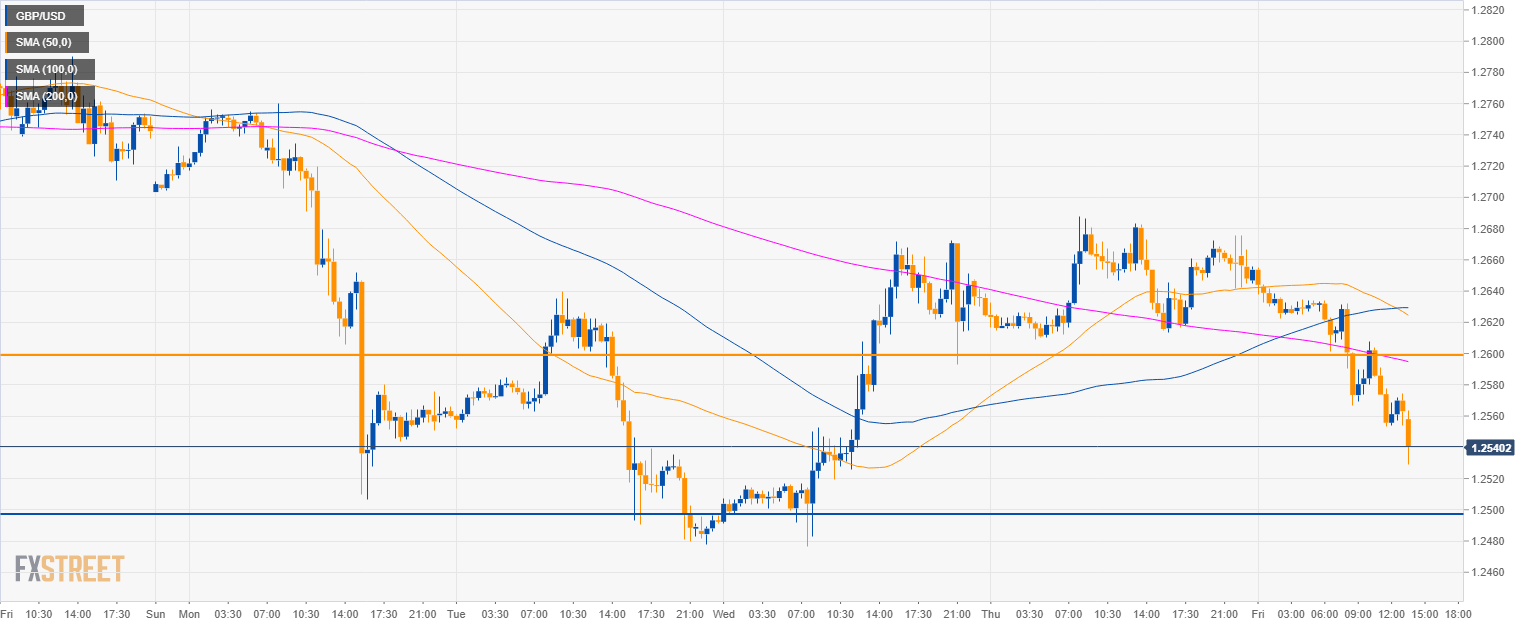
GBP/USD 30-minute chart
- GBP/USD finally broke below the 1.2600 support and the 200 SMA.
- The next objective for bears is the 1.2500 figure.
Additional key levels
GBP/USD
Overview:
Today Last Price: 1.2548
Today Daily change: -1.2e+2 pips
Today Daily change %: -0.924%
Today Daily Open: 1.2665
Trends:
Previous Daily SMA20: 1.2746
Previous Daily SMA50: 1.29
Previous Daily SMA100: 1.2937
Previous Daily SMA200: 1.3263
Levels:
Previous Daily High: 1.2688
Previous Daily Low: 1.2593
Previous Weekly High: 1.284
Previous Weekly Low: 1.2659
Previous Monthly High: 1.3176
Previous Monthly Low: 1.2723
Previous Daily Fibonacci 38.2%: 1.2629
Previous Daily Fibonacci 61.8%: 1.2651
Previous Daily Pivot Point S1: 1.2609
Previous Daily Pivot Point S2: 1.2554
Previous Daily Pivot Point S3: 1.2515
Previous Daily Pivot Point R1: 1.2704
Previous Daily Pivot Point R2: 1.2743
Previous Daily Pivot Point R3: 1.2798
