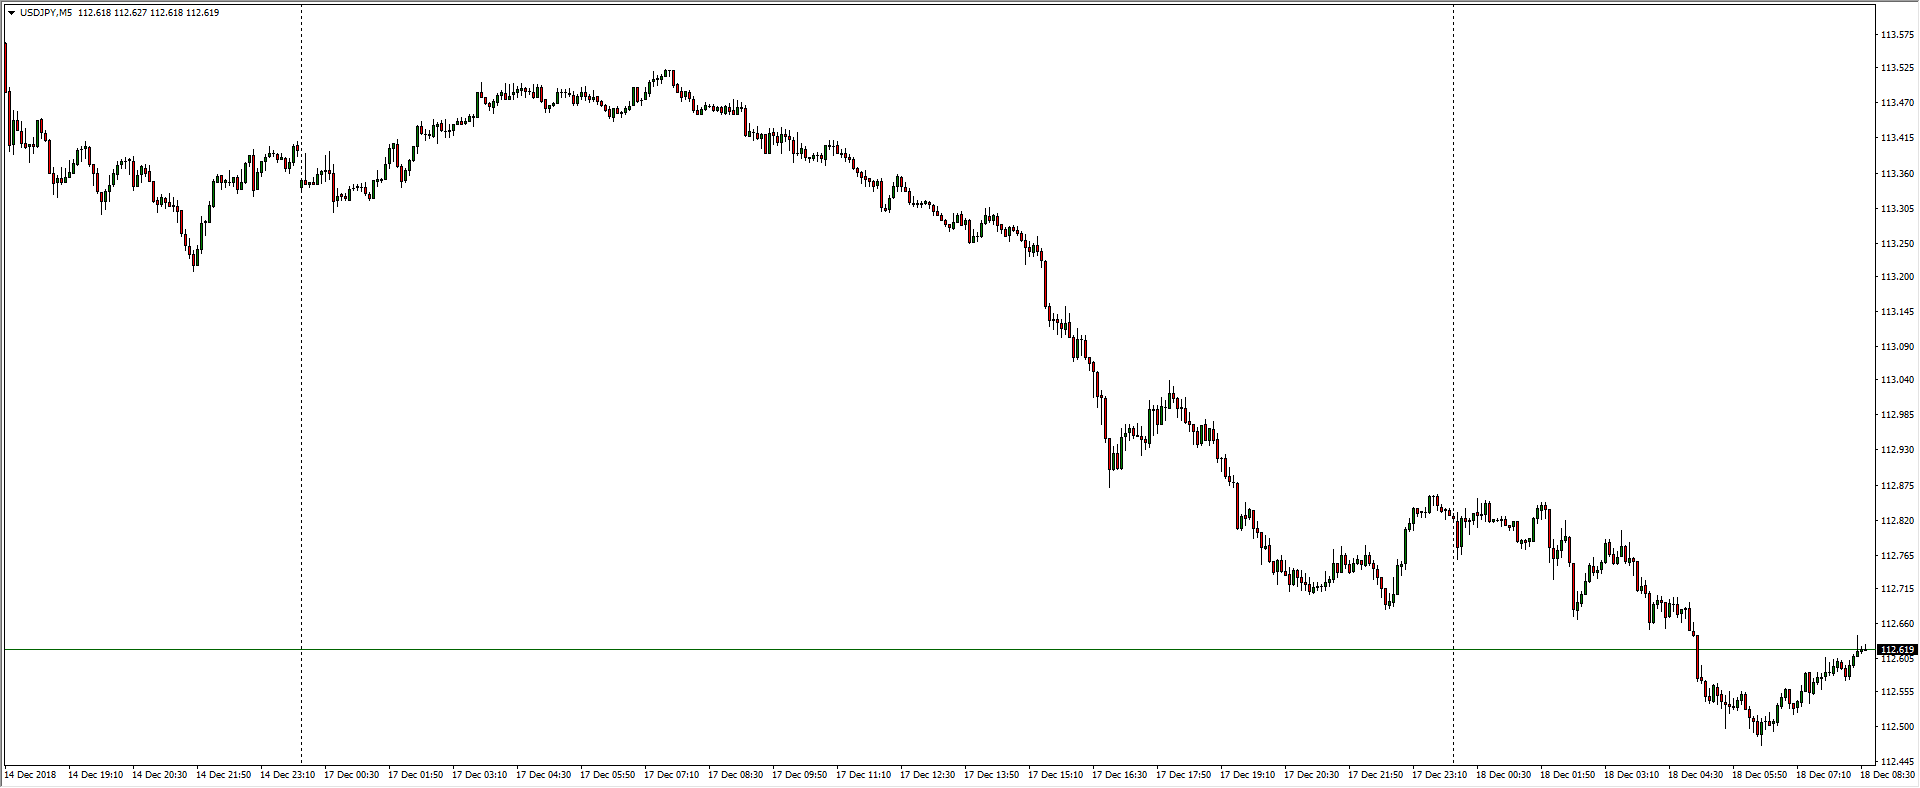
- The Dollar-Yen pairing is heading lower as the greenback steps down across the board, dipping to a new intraday low of 112.46 in early Tuesday action.
USD/JPY, 5-Minute
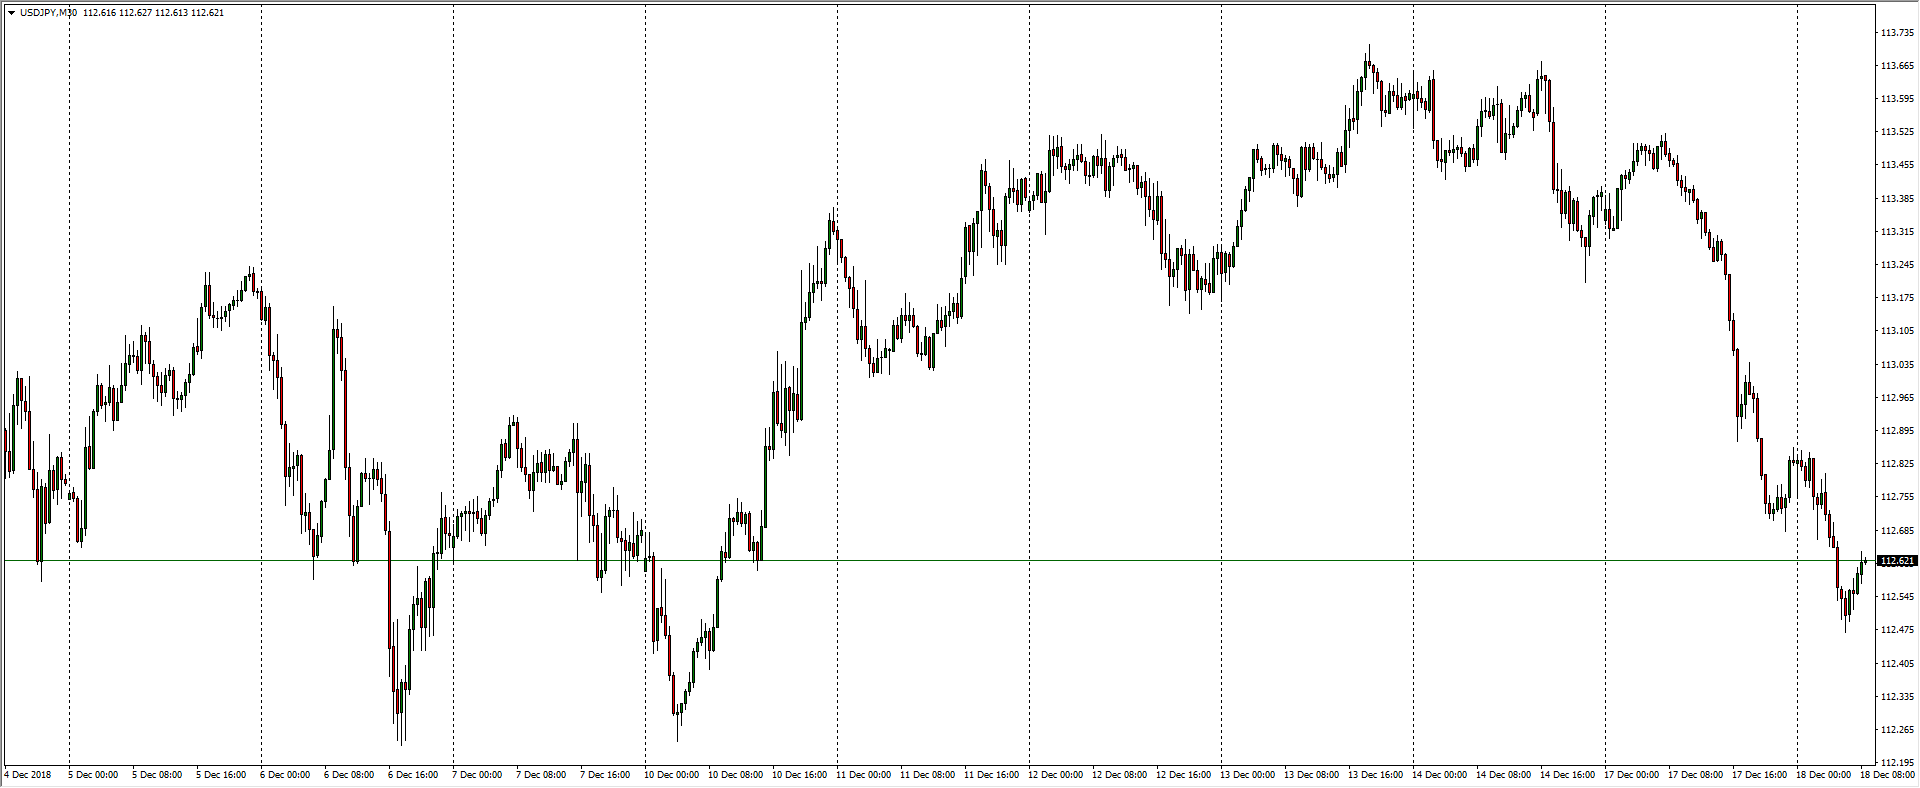
- USD/JPY developed a small bullish case over the past two weeks, but a stallout at 113.70 sees the pair falling back quickly as investors flock to the safe haven.
USD/JPY, 30-Minute
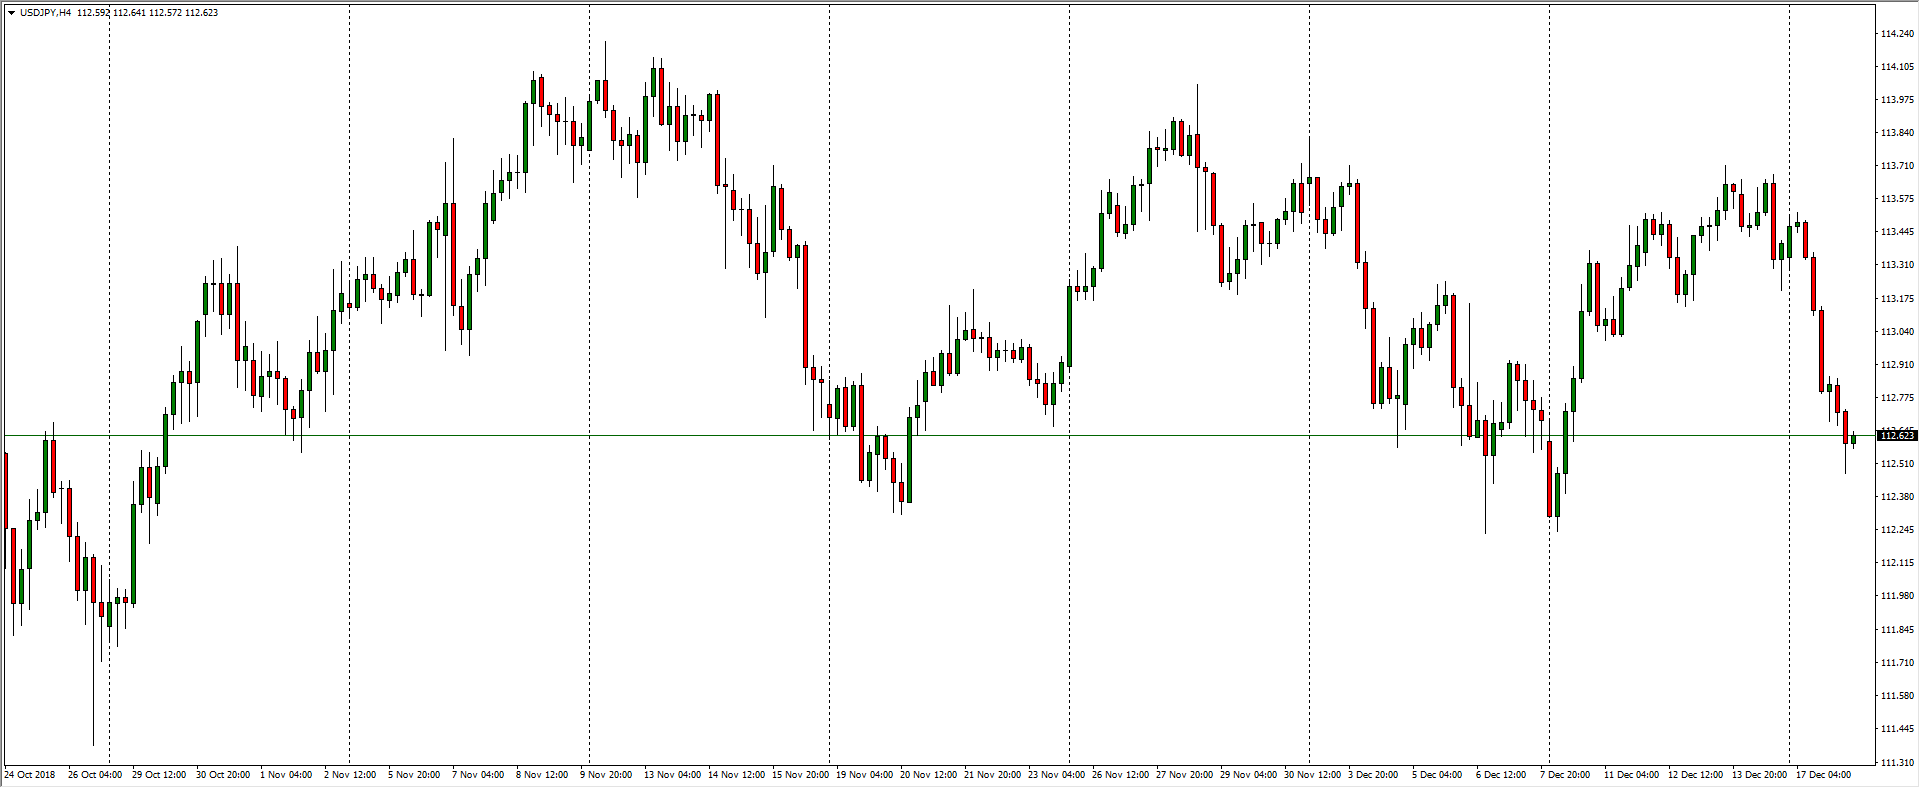
- USD/JPY is dropping into the low end of a channel that has been setting up since late October, locked in between the 114.00 handle and 112.25.
USD/JPY, 4-Hour
USD/JPY
Overview:
Today Last Price: 112.62
Today Daily change: -13 pips
Today Daily change %: -0.115%
Today Daily Open: 112.75
Trends:
Previous Daily SMA20: 113.21
Previous Daily SMA50: 112.99
Previous Daily SMA100: 112.39
Previous Daily SMA200: 110.79
Levels:
Previous Daily High: 113.52
Previous Daily Low: 112.68
Previous Weekly High: 113.71
Previous Weekly Low: 112.24
Previous Monthly High: 114.25
Previous Monthly Low: 112.3
Previous Daily Fibonacci 38.2%: 113
Previous Daily Fibonacci 61.8%: 113.2
Previous Daily Pivot Point S1: 112.45
Previous Daily Pivot Point S2: 112.14
Previous Daily Pivot Point S3: 111.6
Previous Daily Pivot Point R1: 113.29
Previous Daily Pivot Point R2: 113.83
Previous Daily Pivot Point R3: 114.13
