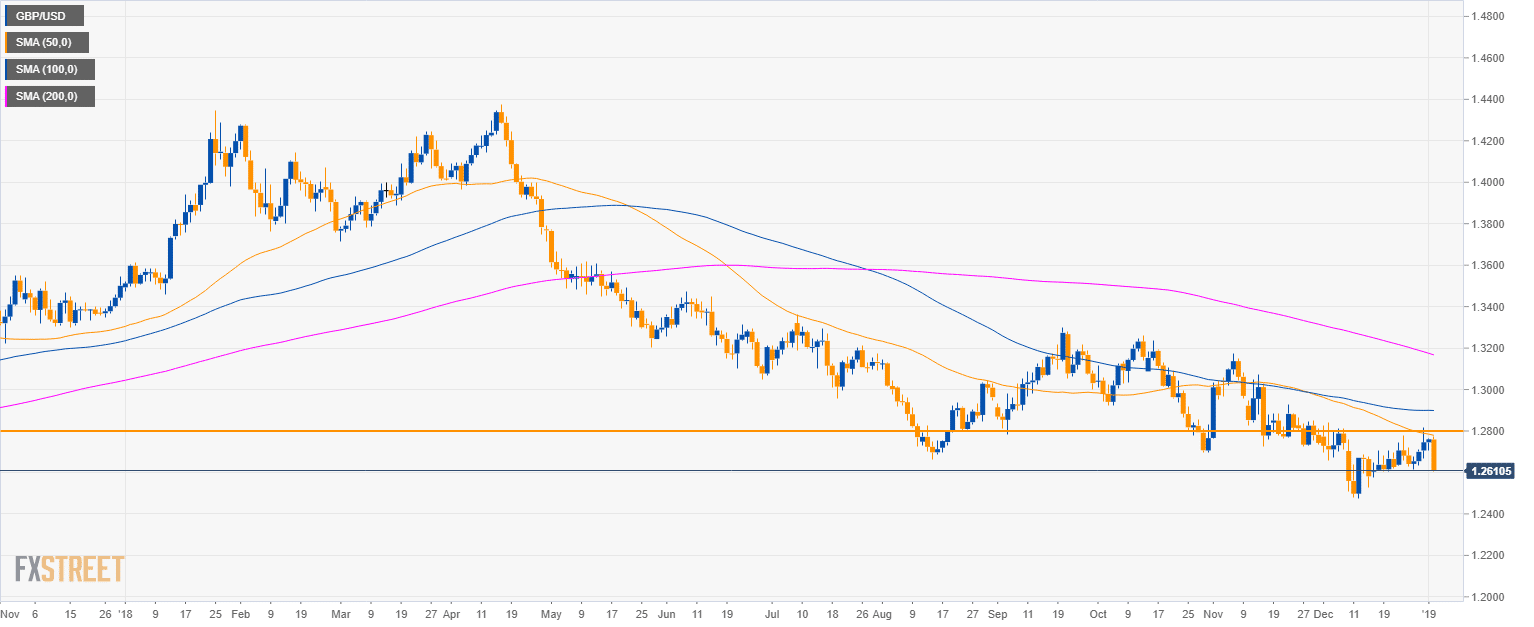
GBP/USD daily chart
- GBP/USD is starting 2019 by strongly rejecting the 1.2800 and 1.2700 figures.
- GBP/USD is trading in a bear trend below the 50, 100 and 200-period simple moving averages (SMAs).
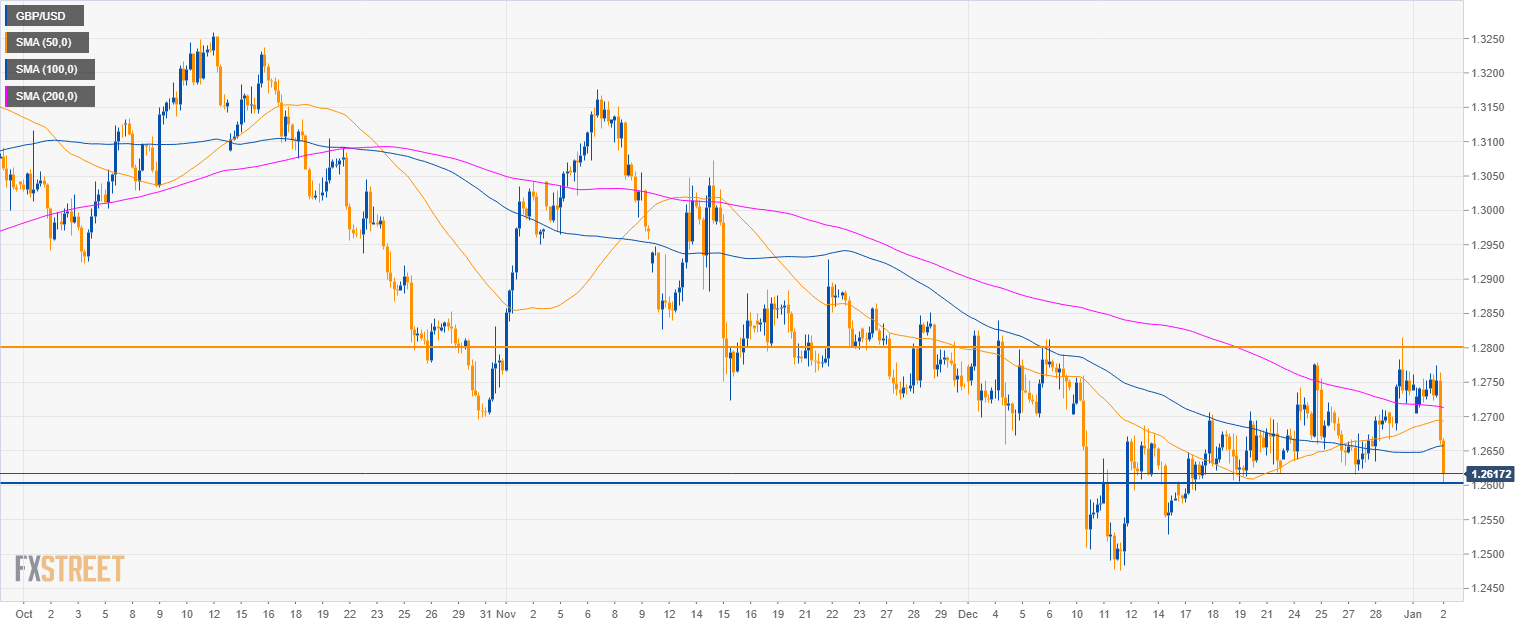
GBP/USD 4-hour chart
- GBP/USD is trading below the 50, 100 and 200-period simple moving averages (SMAs).
- It is now challenging the 1.2600 figure.
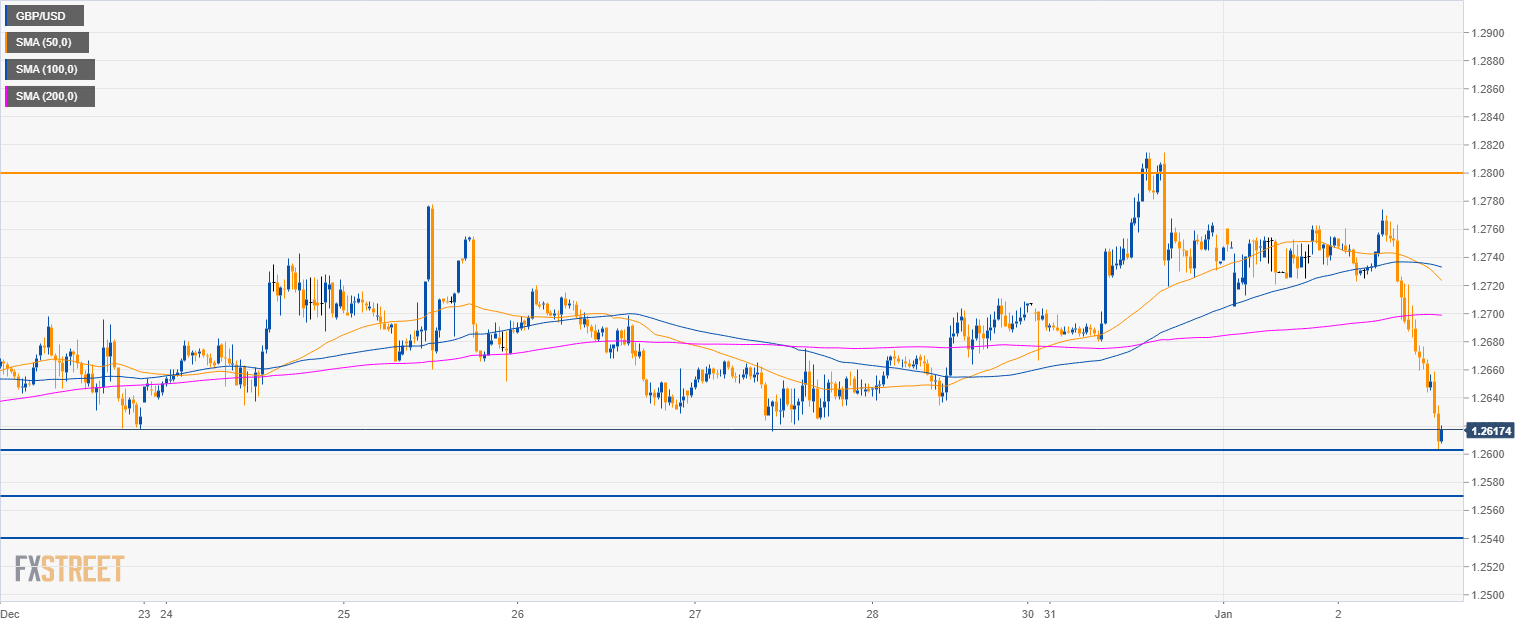
GBP/USD 30-minute chart
- GBP/USD is melting down as it rejected the 50, 100 and 200 SMA.
- The bear trend should see a continuation of the bear move towards 1.2570 and 1.2540 supports.
Additional key levels:
GBP/USD
Overview:
Today Last Price: 1.2615
Today Daily change: -1.4e+2 pips
Today Daily change %: -1.14%
Today Daily Open: 1.276
Trends:
Previous Daily SMA20: 1.2664
Previous Daily SMA50: 1.2784
Previous Daily SMA100: 1.2899
Previous Daily SMA200: 1.3178
Levels:
Previous Daily High: 1.2765
Previous Daily Low: 1.2705
Previous Weekly High: 1.2778
Previous Weekly Low: 1.2616
Previous Monthly High: 1.284
Previous Monthly Low: 1.2477
Previous Daily Fibonacci 38.2%: 1.2742
Previous Daily Fibonacci 61.8%: 1.2728
Previous Daily Pivot Point S1: 1.2722
Previous Daily Pivot Point S2: 1.2683
Previous Daily Pivot Point S3: 1.2662
Previous Daily Pivot Point R1: 1.2782
Previous Daily Pivot Point R2: 1.2803
Previous Daily Pivot Point R3: 1.2842
