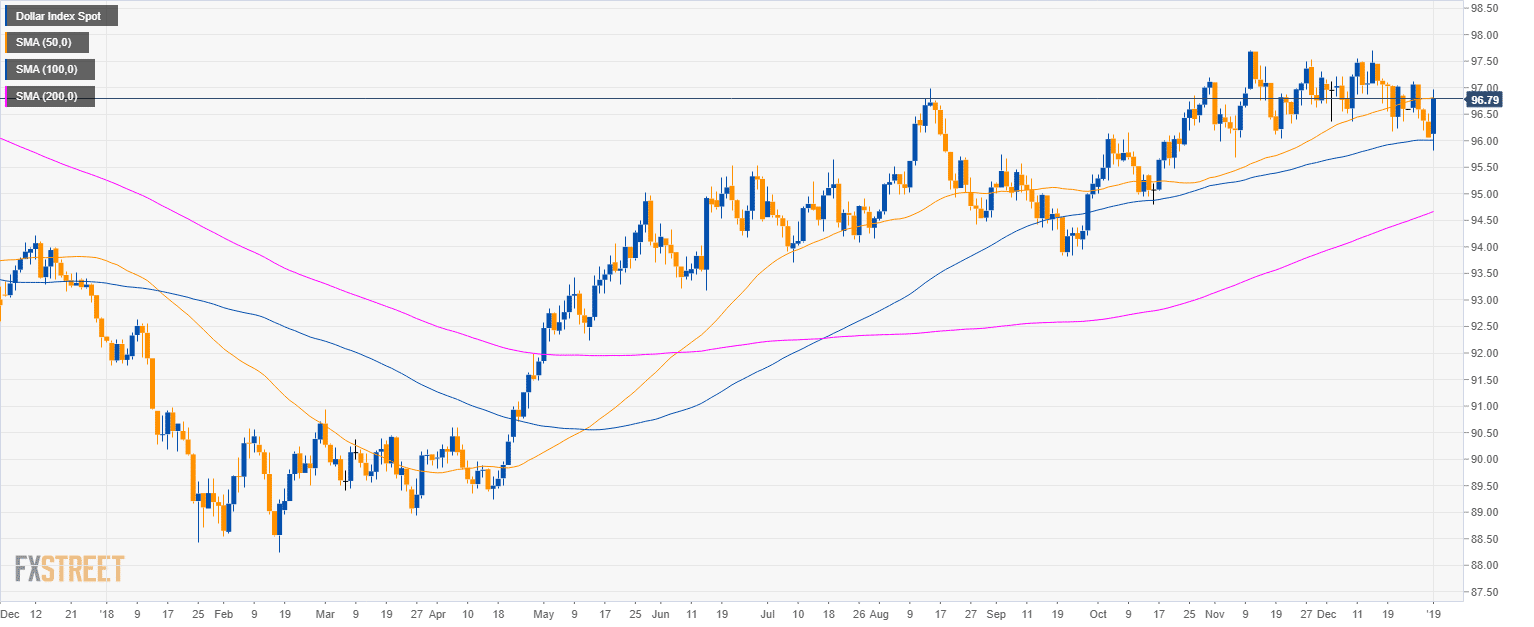
DXY daily chart
- The US Dollar Index (DXY) is trading in a bull trend above the 200-period simple moving average (SMA).
- DXY is testing the 50 SMA and the 97.00 figure.
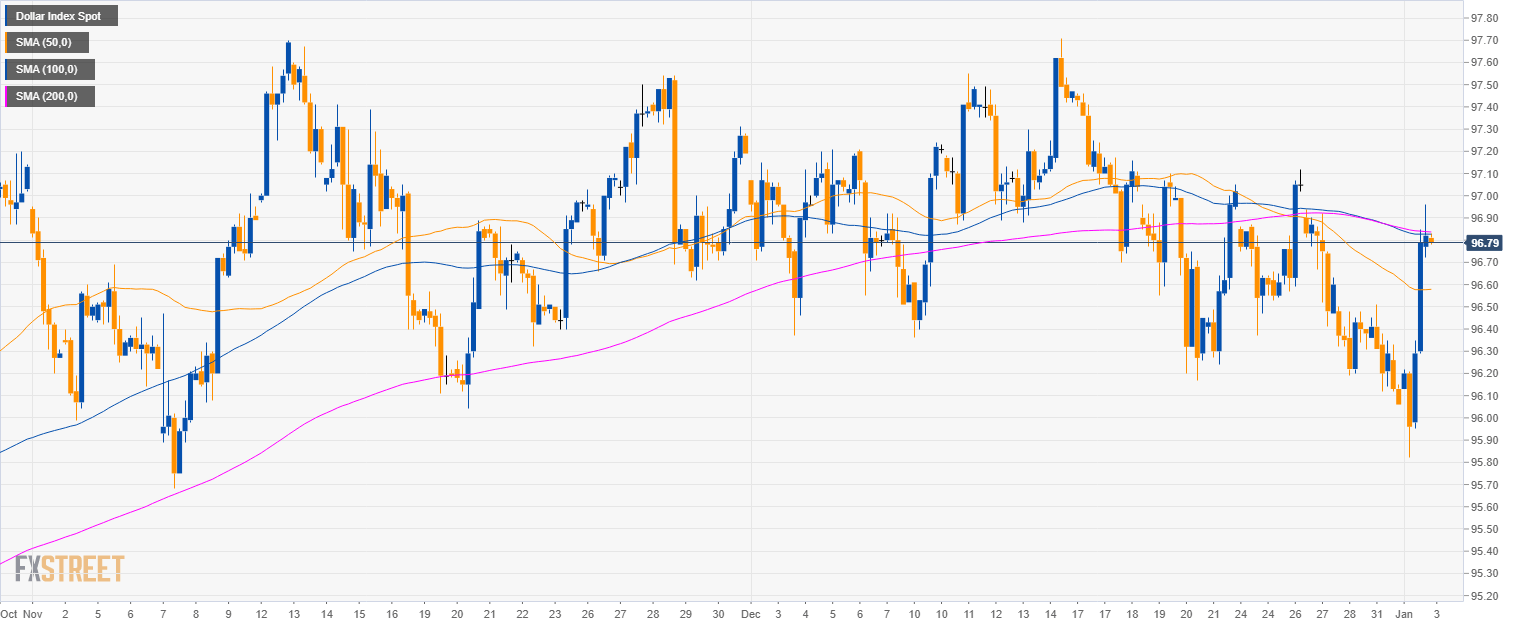
DXY 4-hour chart
- DXY is spiking up and found some resistance at the 100 and 200 SMAs.
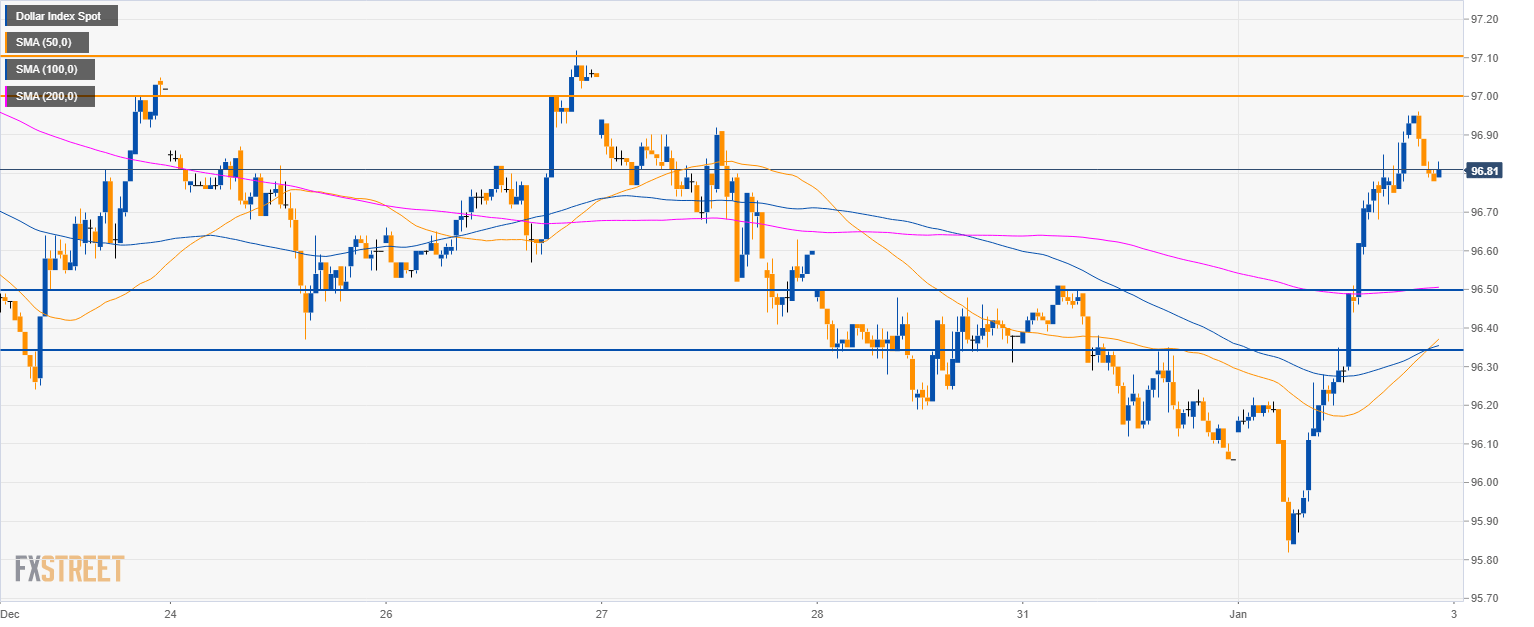
DXY 30-minute chart
- The level to beat for US Dollar bulls is 97.00 and the 97.10 level.
- If bears take the lead then a pullback down to 95.50 and 96.34 is likely on the cards.
- The bears are likely in charge.
Additional key levels
USD/CHF
Overview:
Today Last Price: 0.9904
Today Daily change: 83 pips
Today Daily change %: 0.845%
Today Daily Open: 0.9821
Trends:
Previous Daily SMA20: 0.9909
Previous Daily SMA50: 0.9968
Previous Daily SMA100: 0.9885
Previous Daily SMA200: 0.9877
Levels:
Previous Daily High: 0.9844
Previous Daily Low: 0.9809
Previous Weekly High: 0.9964
Previous Weekly Low: 0.979
Previous Monthly High: 1.0009
Previous Monthly Low: 0.979
Previous Daily Fibonacci 38.2%: 0.9822
Previous Daily Fibonacci 61.8%: 0.9831
Previous Daily Pivot Point S1: 0.9805
Previous Daily Pivot Point S2: 0.979
Previous Daily Pivot Point S3: 0.977
Previous Daily Pivot Point R1: 0.984
Previous Daily Pivot Point R2: 0.986
Previous Daily Pivot Point R3: 0.9875
