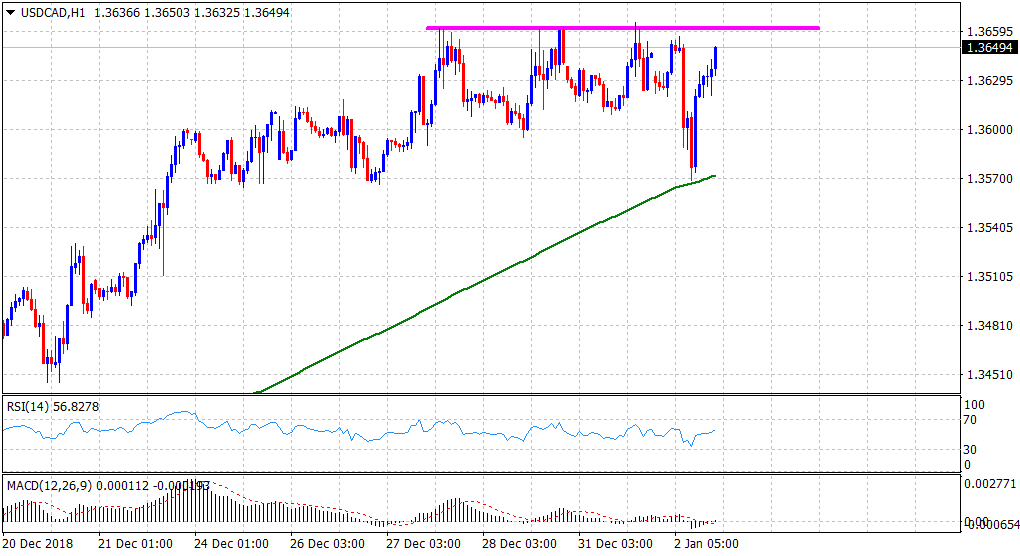
“¢ The pair found decent support near 200-hour SMA and reversed its intraday corrective slide to move back closer to the top end of its daily trading range.
“¢ Technical indicators on hourly charts have regained positive traction and support prospects for further appreciating move amid a pickup in the USD demand.
“¢ However, oscillators on the daily chart are still pointing to slightly overbought conditions and might turn out to be the only factor keeping a lid on additional gains.
“¢ Hence, any subsequent up-move might continue to confront fresh supply and remain capped near the 1.3660 region, or over 19-month tops set recently.
USD/CAD 1-hourly chart
USD/CAD
Overview:
Today Last Price: 1.364
Today Daily change: 0.0 pips
Today Daily change %: 0.00%
Today Daily Open: 1.364
Trends:
Previous Daily SMA20: 1.3513
Previous Daily SMA50: 1.3317
Previous Daily SMA100: 1.3166
Previous Daily SMA200: 1.3067
Levels:
Previous Daily High: 1.3658
Previous Daily Low: 1.3422
Previous Weekly High: 1.4134
Previous Weekly Low: 1.3564
Previous Monthly High: 1.4134
Previous Monthly Low: 1.316
Previous Daily Fibonacci 38.2%: 1.3512
Previous Daily Fibonacci 61.8%: 1.3568
Previous Daily Pivot Point S1: 1.3489
Previous Daily Pivot Point S2: 1.3337
Previous Daily Pivot Point S3: 1.3252
Previous Daily Pivot Point R1: 1.3725
Previous Daily Pivot Point R2: 1.381
Previous Daily Pivot Point R3: 1.3962
