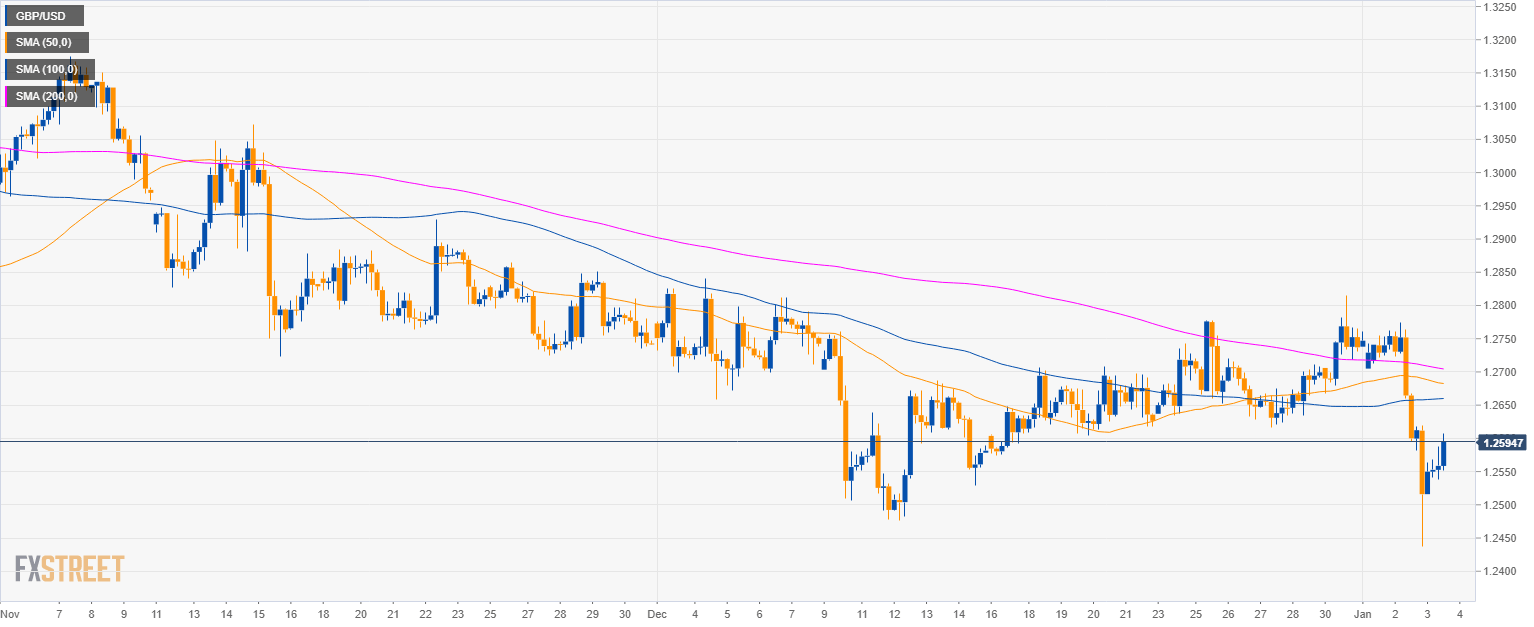
GBP/USD daily chart
- GBP/USD is trading in a bear trend below the 200-period simple moving average (SMA).

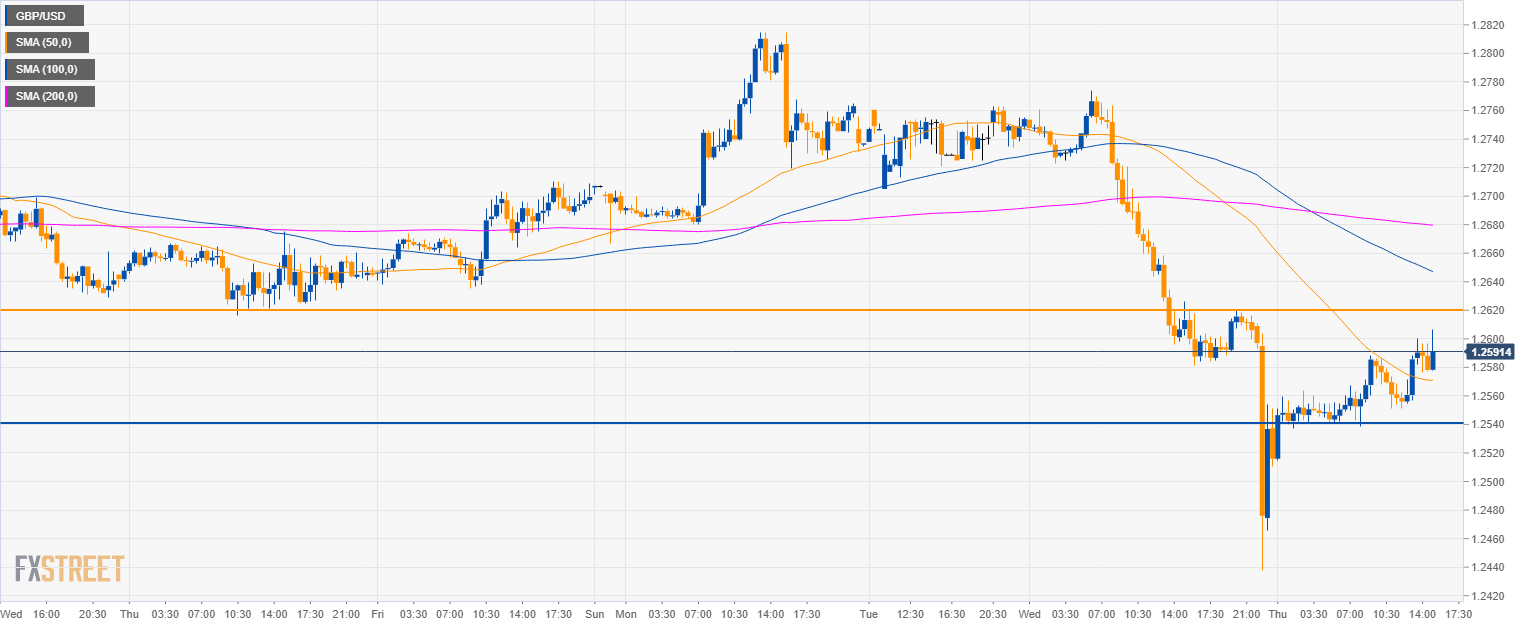
GBP/USD 4-hour chart
- GBP/USD is trading below its main SMAs suggesting bearish momentum.
GBP/USD 30-minute chart
- GBP/USD is consolidating Wednesday’s losses below the 100 and 200 SMAs.
- The momentum is bearish and the level to beat for bears is the 1.2540 level which would open the doors to 1.2500 figure.
- On the flip side, resistance is seen at the 1.2620 level.
Additional key levels
GBP/USD
Overview:
Today Last Price: 1.2591
Today Daily change: -21 pips
Today Daily change %: -0.167%
Today Daily Open: 1.2612
Trends:
Previous Daily SMA20: 1.2658
Previous Daily SMA50: 1.2779
Previous Daily SMA100: 1.2898
Previous Daily SMA200: 1.317
Levels:
Previous Daily High: 1.2774
Previous Daily Low: 1.2581
Previous Weekly High: 1.2778
Previous Weekly Low: 1.2616
Previous Monthly High: 1.284
Previous Monthly Low: 1.2477
Previous Daily Fibonacci 38.2%: 1.2655
Previous Daily Fibonacci 61.8%: 1.27
Previous Daily Pivot Point S1: 1.2537
Previous Daily Pivot Point S2: 1.2463
Previous Daily Pivot Point S3: 1.2344
Previous Daily Pivot Point R1: 1.273
Previous Daily Pivot Point R2: 1.2849
Previous Daily Pivot Point R3: 1.2923
