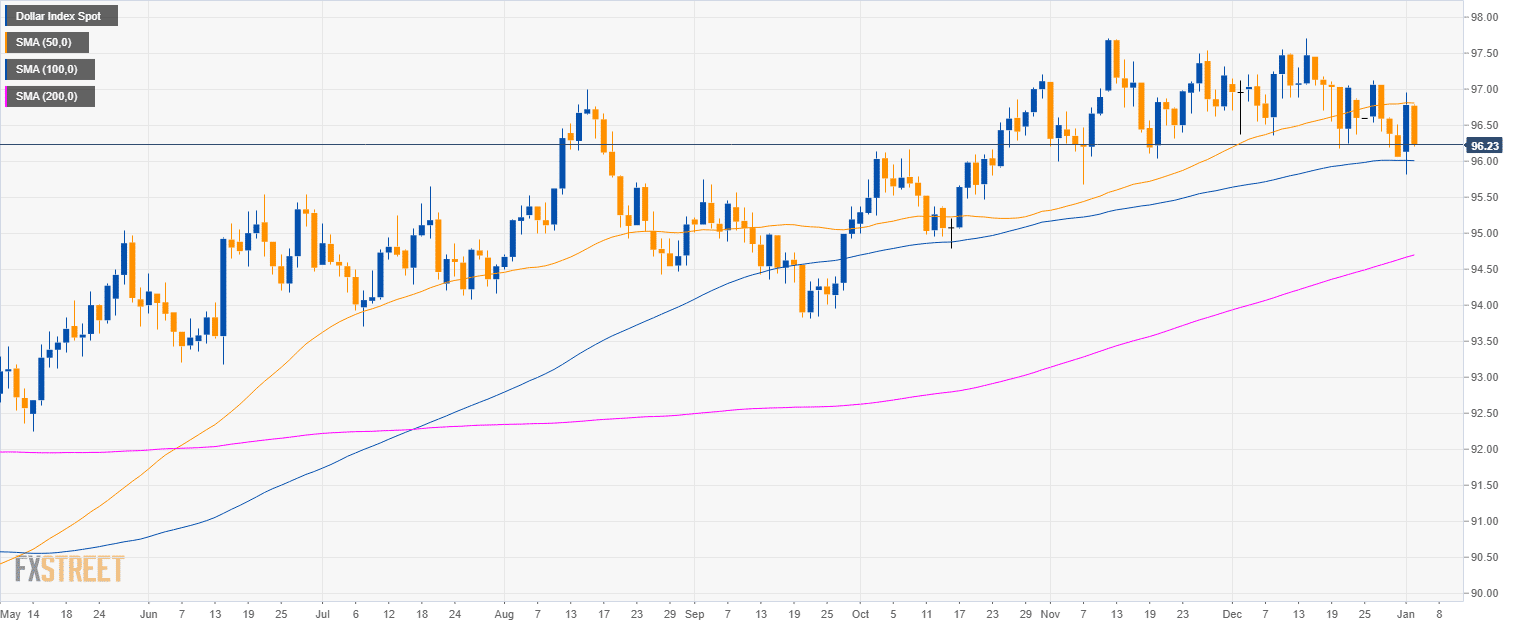
DXY daily chart
- The US Dollar Index (DXY) is trading in a bull trend above the 200-period simple moving average (SMA).
- DXY is approaching 96.00 figure and the 100 SMA on the way down.
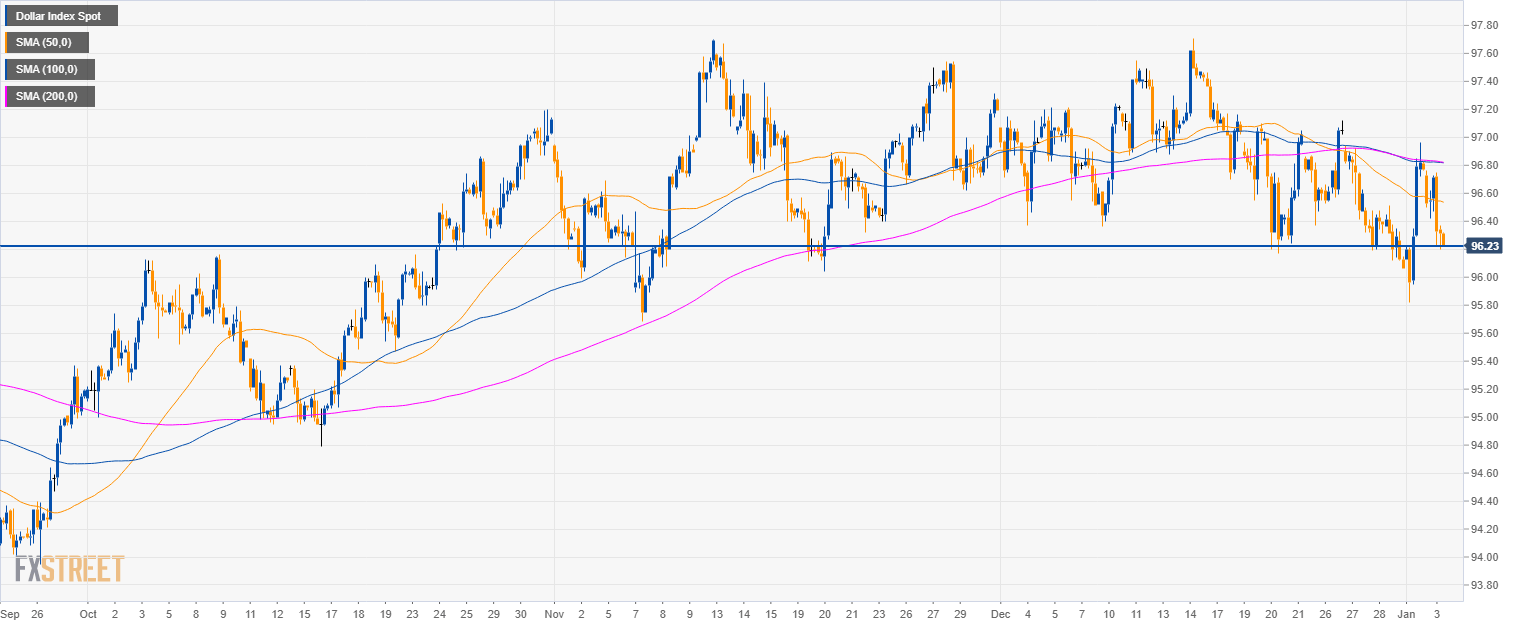
DXY 4-hour chart
- DXY is testing 96.20 an important support/resistance level in the last months of trading.
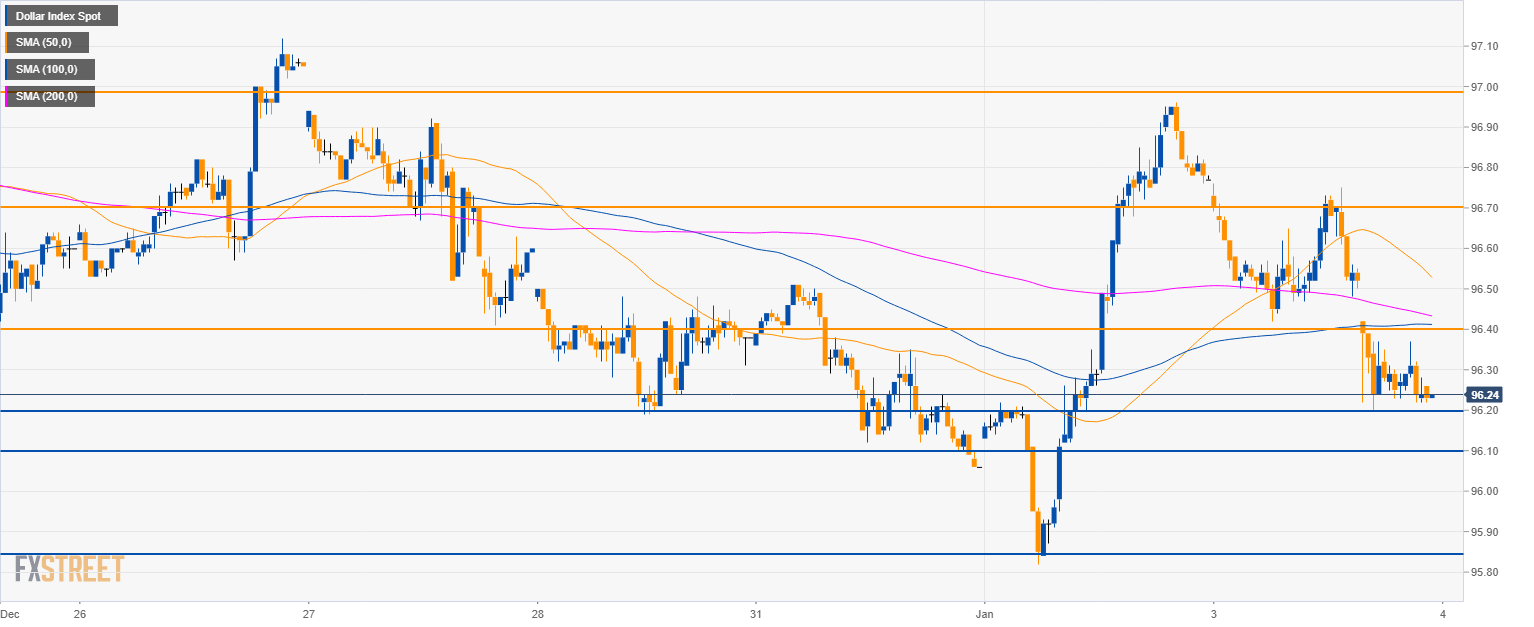
DXY 30-minute chart
- If bears break 96.20 then 96.10 and 95.83 can be on the cards.
- On the flip side, if bulls gather enough steam above 96.40 then 96.70 and 97.00 can become the next targets in the coming sessions.
Additional key levels
EUR/USD
Overview:
Today Last Price: 1.14
Today Daily change: 54 pips
Today Daily change %: 0.476%
Today Daily Open: 1.1346
Trends:
Previous Daily SMA20: 1.1387
Previous Daily SMA50: 1.1372
Previous Daily SMA100: 1.148
Previous Daily SMA200: 1.1657
Levels:
Previous Daily High: 1.152
Previous Daily Low: 1.1325
Previous Weekly High: 1.1478
Previous Weekly Low: 1.1343
Previous Monthly High: 1.1486
Previous Monthly Low: 1.1269
Previous Daily Fibonacci 38.2%: 1.1399
Previous Daily Fibonacci 61.8%: 1.1445
Previous Daily Pivot Point S1: 1.1274
Previous Daily Pivot Point S2: 1.1202
Previous Daily Pivot Point S3: 1.108
Previous Daily Pivot Point R1: 1.1468
Previous Daily Pivot Point R2: 1.1591
Previous Daily Pivot Point R3: 1.1663
