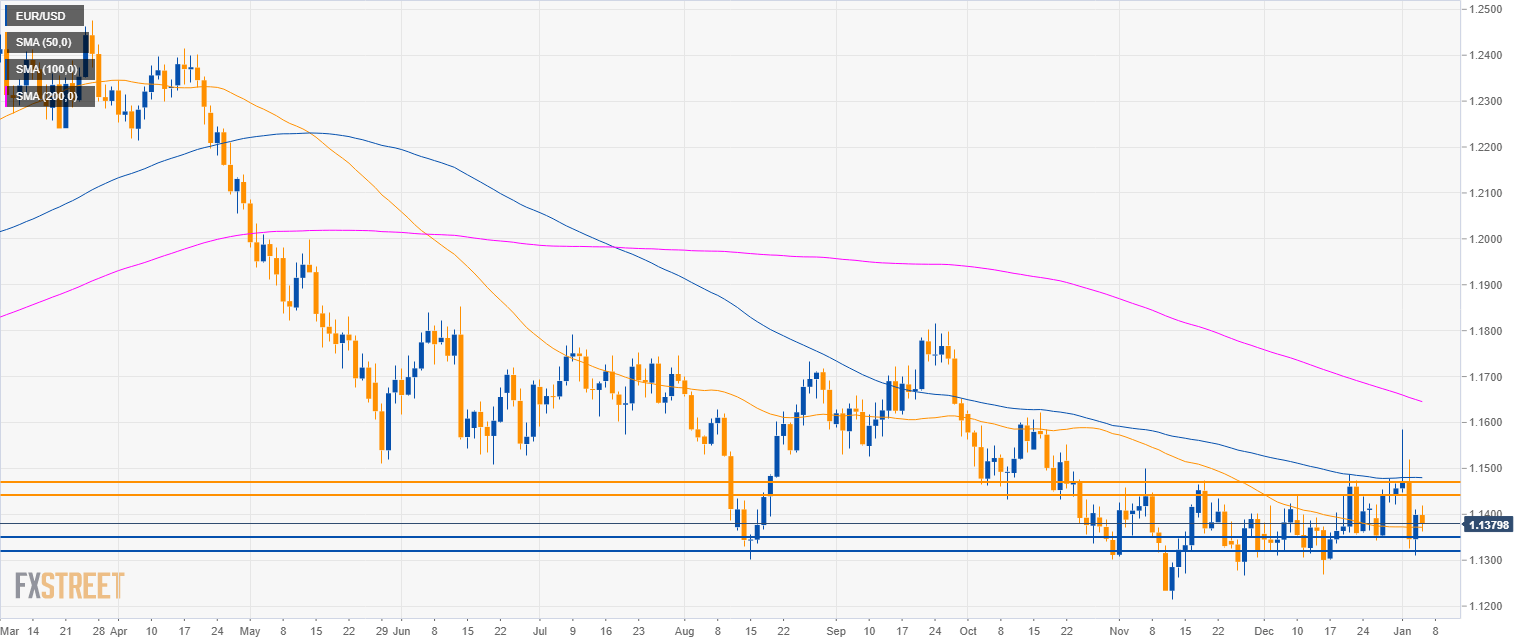
EUR/USD daily chart
- EUR/USD is trading in a bear trend below the 200-period simple moving average (SMA).
- The US nonfarm payrolls (NFP) for December 2018 came in above expectations at 312K vs. 177K forecast which is potentially bullish for the Greenback.
- This makes December 2018 the fourth largest monthly jobs increase since the 2009 recession.
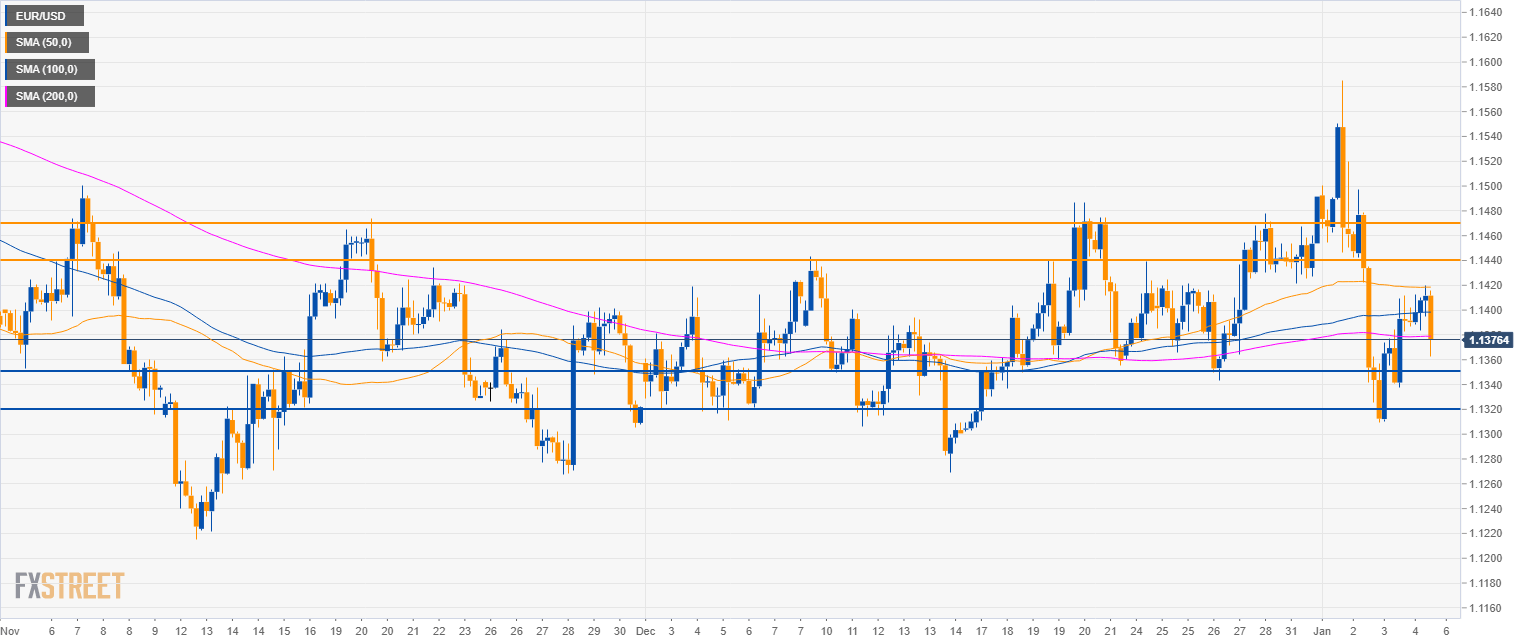
EUR/USD 4-hour chart
- EUR/USD is currently challenging the 200 SMA and the 1.1370 level.
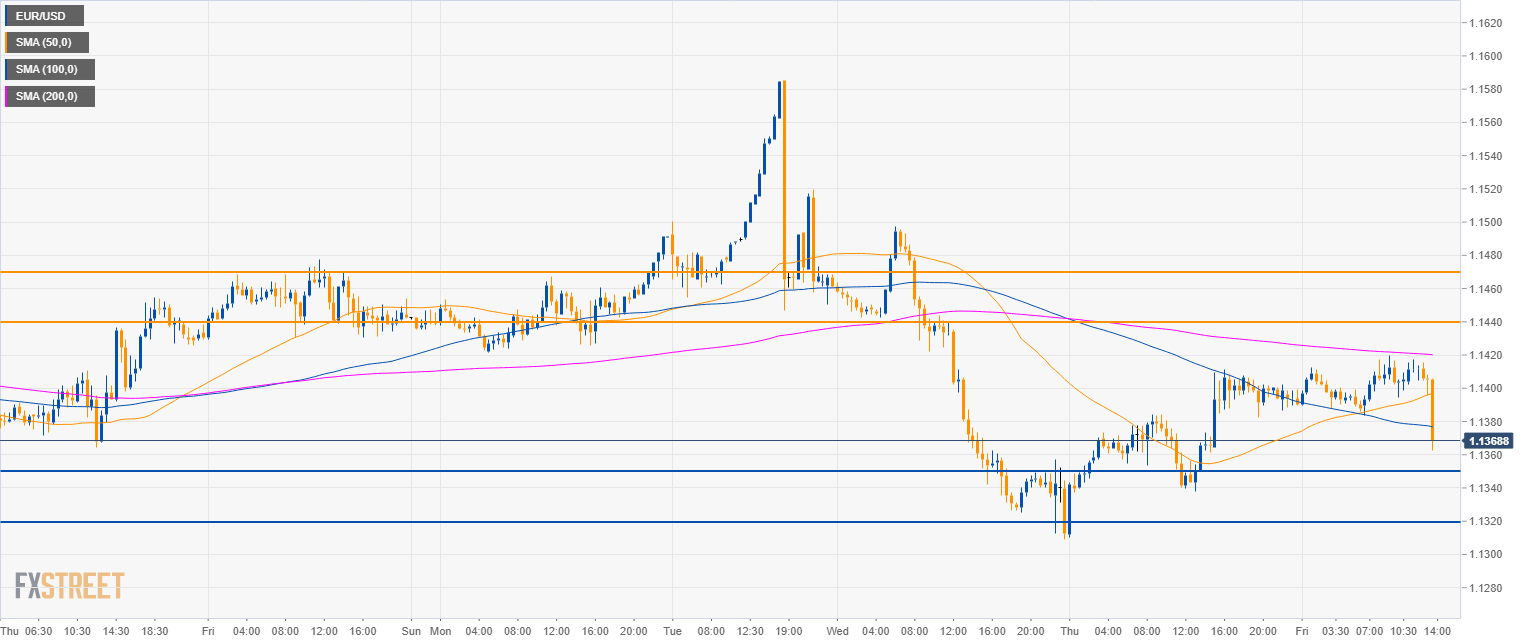
EUR/USD 30-minute chart
- EUR/USD is currently capped by the 200 SMA.
- EUR/USD rejected the 50 SMA and 1.1350 and 1.1320 are seen as potential bear targets.
Additional key levels
EUR/USD
Overview:
Today Last Price: 1.1376
Today Daily change: -22 pips
Today Daily change %: -0.193%
Today Daily Open: 1.1398
Trends:
Previous Daily SMA20: 1.1388
Previous Daily SMA50: 1.1372
Previous Daily SMA100: 1.148
Previous Daily SMA200: 1.1652
Levels:
Previous Daily High: 1.1412
Previous Daily Low: 1.1309
Previous Weekly High: 1.1478
Previous Weekly Low: 1.1343
Previous Monthly High: 1.1486
Previous Monthly Low: 1.1269
Previous Daily Fibonacci 38.2%: 1.1372
Previous Daily Fibonacci 61.8%: 1.1348
Previous Daily Pivot Point S1: 1.1335
Previous Daily Pivot Point S2: 1.1271
Previous Daily Pivot Point S3: 1.1232
Previous Daily Pivot Point R1: 1.1437
Previous Daily Pivot Point R2: 1.1475
Previous Daily Pivot Point R3: 1.1539
