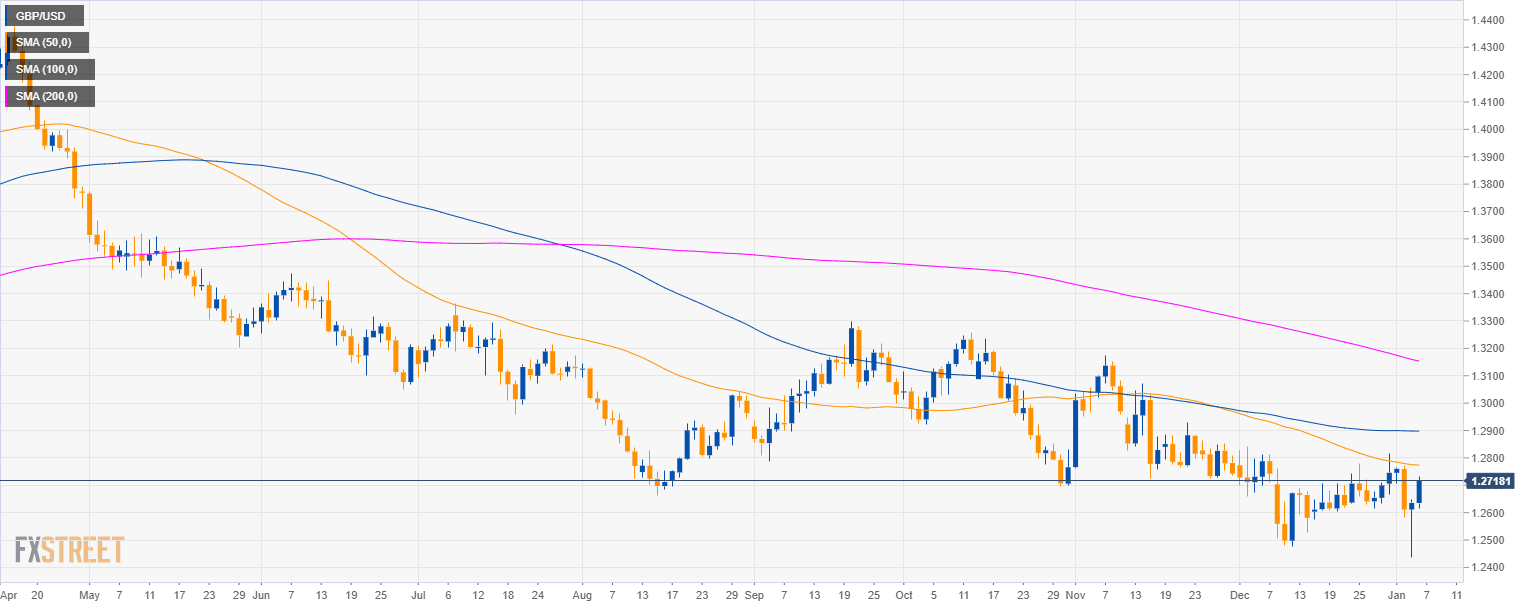
GBP/USD daily chart
- GBP/USD is trading in a bear trend below the 200-period simple moving average (SMA).
- Bulls are trying to reclaim the 1.2700 figure.
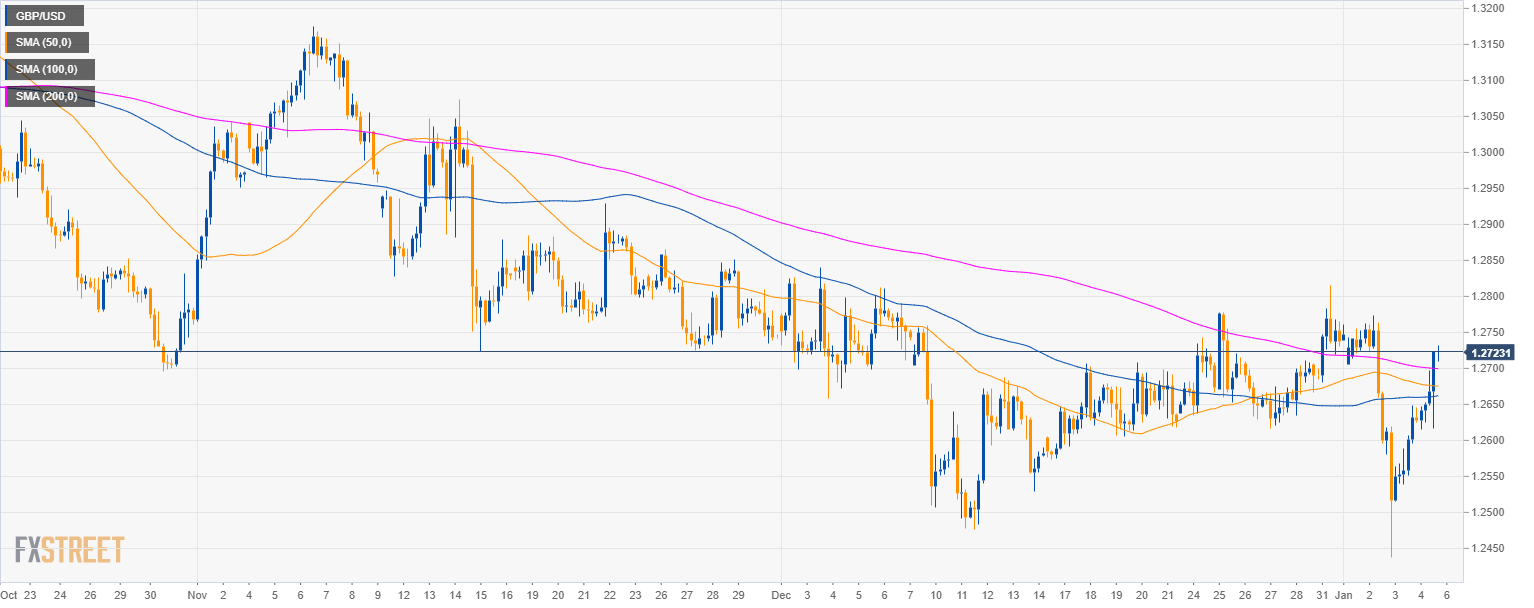
GBP/USD 4-hour chart
- GBP/USD has regained the 200 SMA.
GBP/USD 30-minute chart
- GBP/USD broke above the 200 SMA.
- If GBP/USD bulls break above 1.2740 the market could accelerate to 1.2800 figure.

Additional key levels
GBP/USD
Overview:
Today Last Price: 1.2729
Today Daily change: 94 pips
Today Daily change %: 0.744%
Today Daily Open: 1.2635
Trends:
Previous Daily SMA20: 1.265
Previous Daily SMA50: 1.2775
Previous Daily SMA100: 1.2898
Previous Daily SMA200: 1.3162
Levels:
Previous Daily High: 1.2648
Previous Daily Low: 1.2438
Previous Weekly High: 1.2778
Previous Weekly Low: 1.2616
Previous Monthly High: 1.284
Previous Monthly Low: 1.2477
Previous Daily Fibonacci 38.2%: 1.2568
Previous Daily Fibonacci 61.8%: 1.2518
Previous Daily Pivot Point S1: 1.2499
Previous Daily Pivot Point S2: 1.2363
Previous Daily Pivot Point S3: 1.2289
Previous Daily Pivot Point R1: 1.271
Previous Daily Pivot Point R2: 1.2784
Previous Daily Pivot Point R3: 1.292
