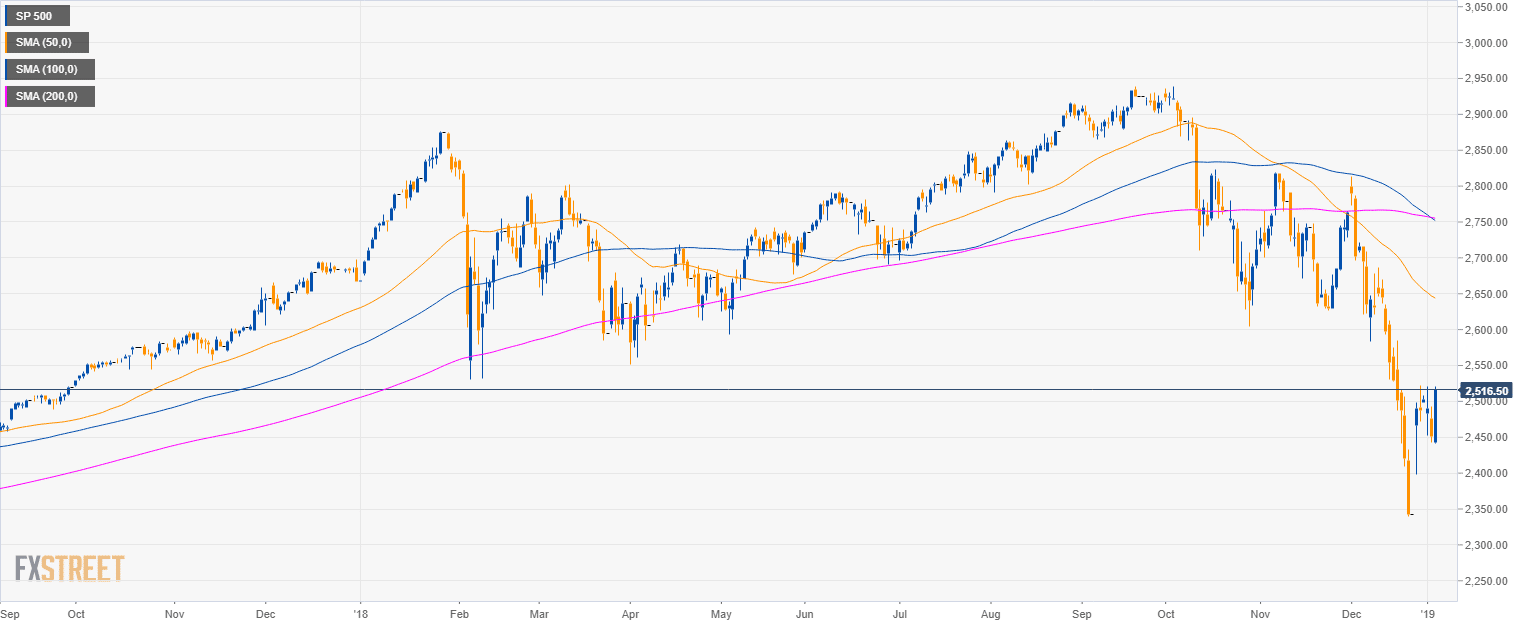
S&P500 daily chart
- The S&P500 is having a deep pullback below the 50, 100 and 200-period simple moving averages (SMAs).
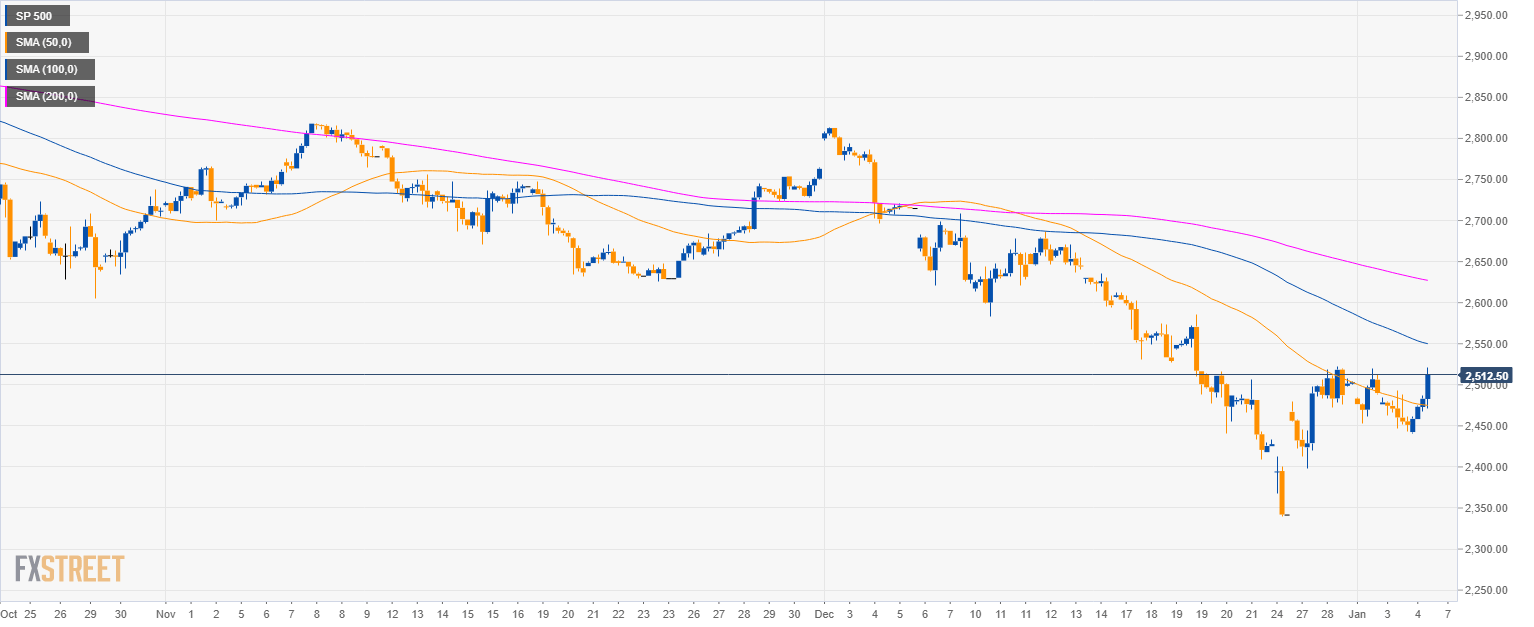
S&P500 4-hour chart
- The S&P500 broke above the 2,500.00 psychological level and the 50 SMA.
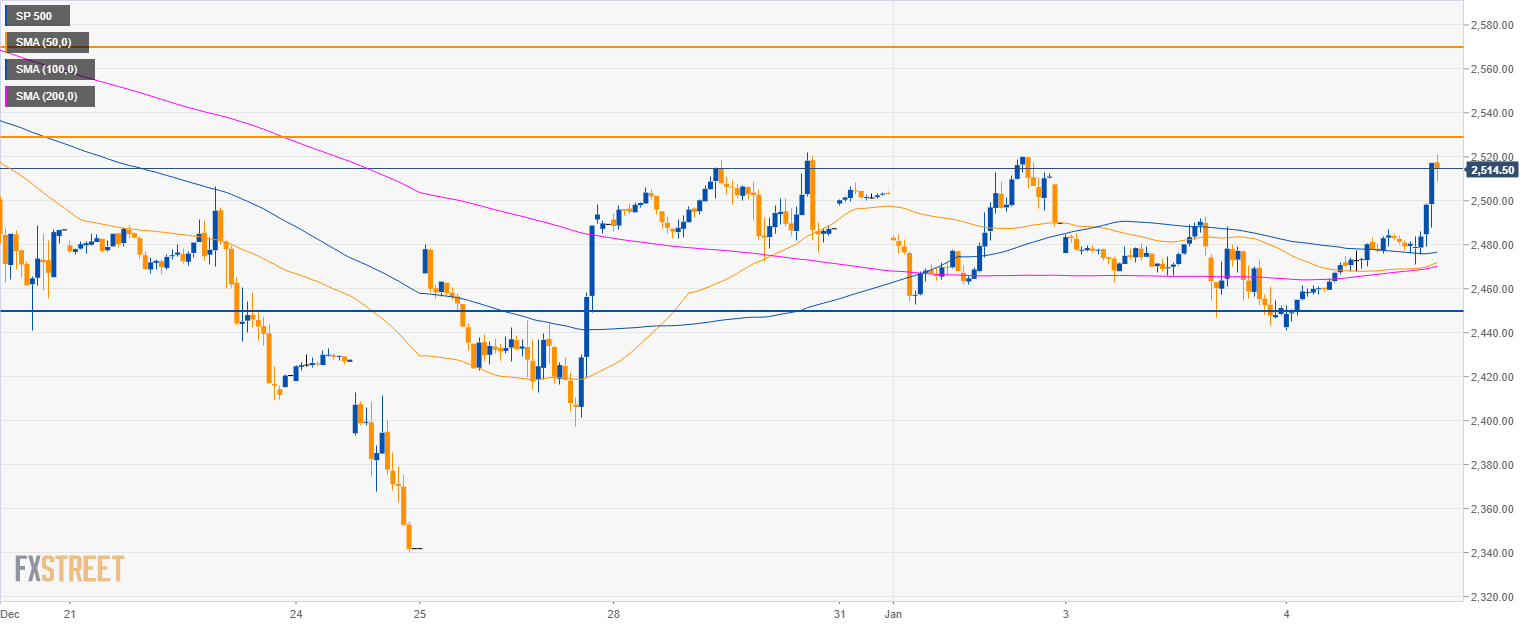
S&P500 30-minute chart
- The S&P500 broke above the 50, 100 and 200 SMAs as the bulls are taking control.
- If sellers keep the momentum going then 2,530.00 and 2,570.00 are seen as potential bull targets in the coming sessions.
Additional key levels
SP 500
Overview:
Today Last Price: 2509.5
Today Daily change: 5.8e+3 pips
Today Daily change %: 2.38%
Today Daily Open: 2451.25
Trends:
Previous Daily SMA20: 2540.32
Previous Daily SMA50: 2646.92
Previous Daily SMA100: 2755.64
Previous Daily SMA200: 2756.28
Levels:
Previous Daily High: 2493
Previous Daily Low: 2443.25
Previous Weekly High: 2521.75
Previous Weekly Low: 2340.25
Previous Monthly High: 2813.5
Previous Monthly Low: 2340.25
Previous Daily Fibonacci 38.2%: 2462.25
Previous Daily Fibonacci 61.8%: 2474
Previous Daily Pivot Point S1: 2432
Previous Daily Pivot Point S2: 2412.75
Previous Daily Pivot Point S3: 2382.25
Previous Daily Pivot Point R1: 2481.75
Previous Daily Pivot Point R2: 2512.25
Previous Daily Pivot Point R3: 2531.5
