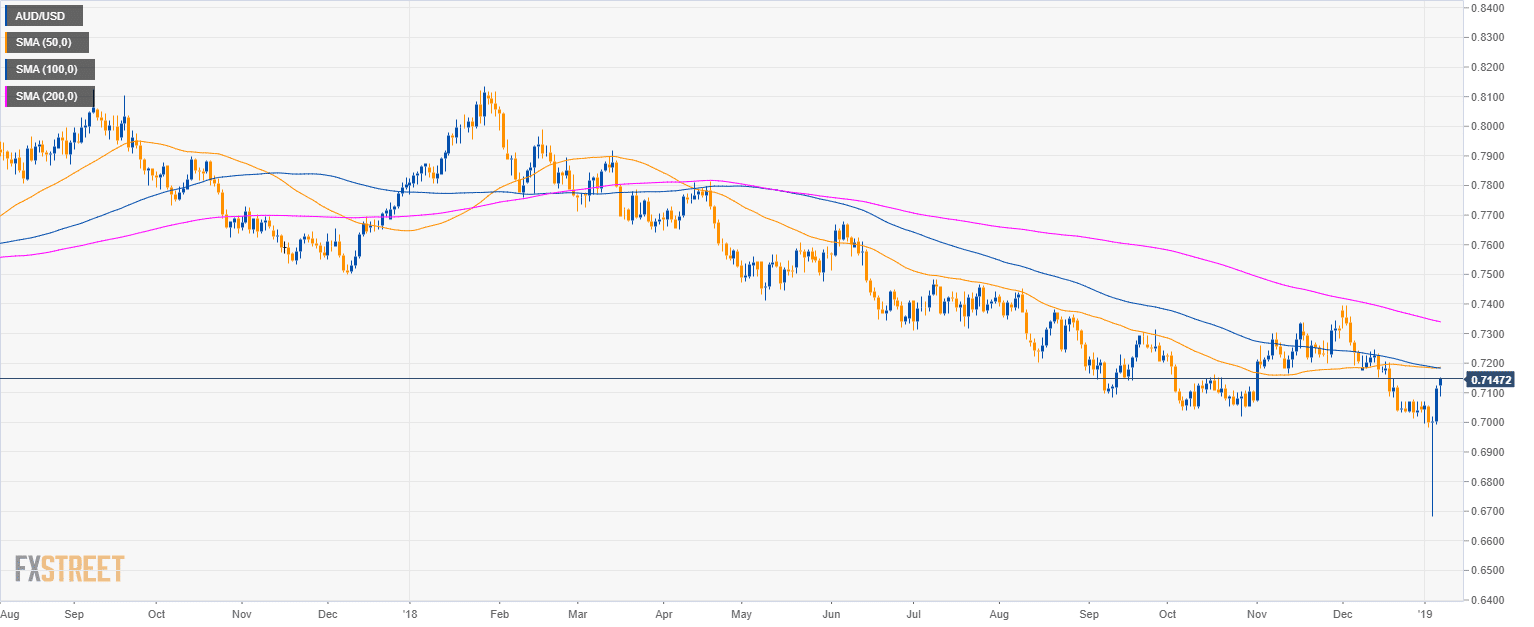
AUD/USD daily chart
- AUD/USD is trading in a bear trend below the 50, 100 and 200-period simple moving averages (SMAs).
- AUD/USD had a 300-pip recovery after the flash crash last week.
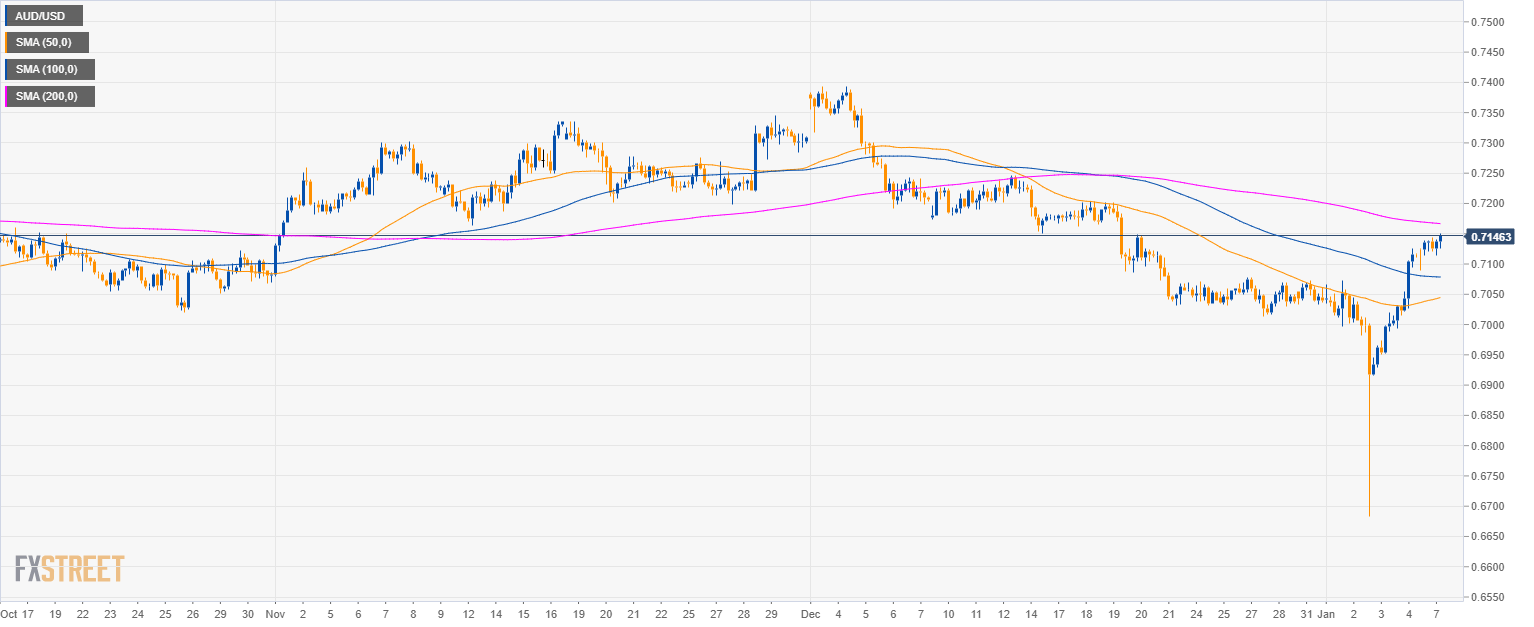
AUD/USD 4-hour chart
- AUD/USD broke above the 0.7100 figure and is near the 200 SMA.
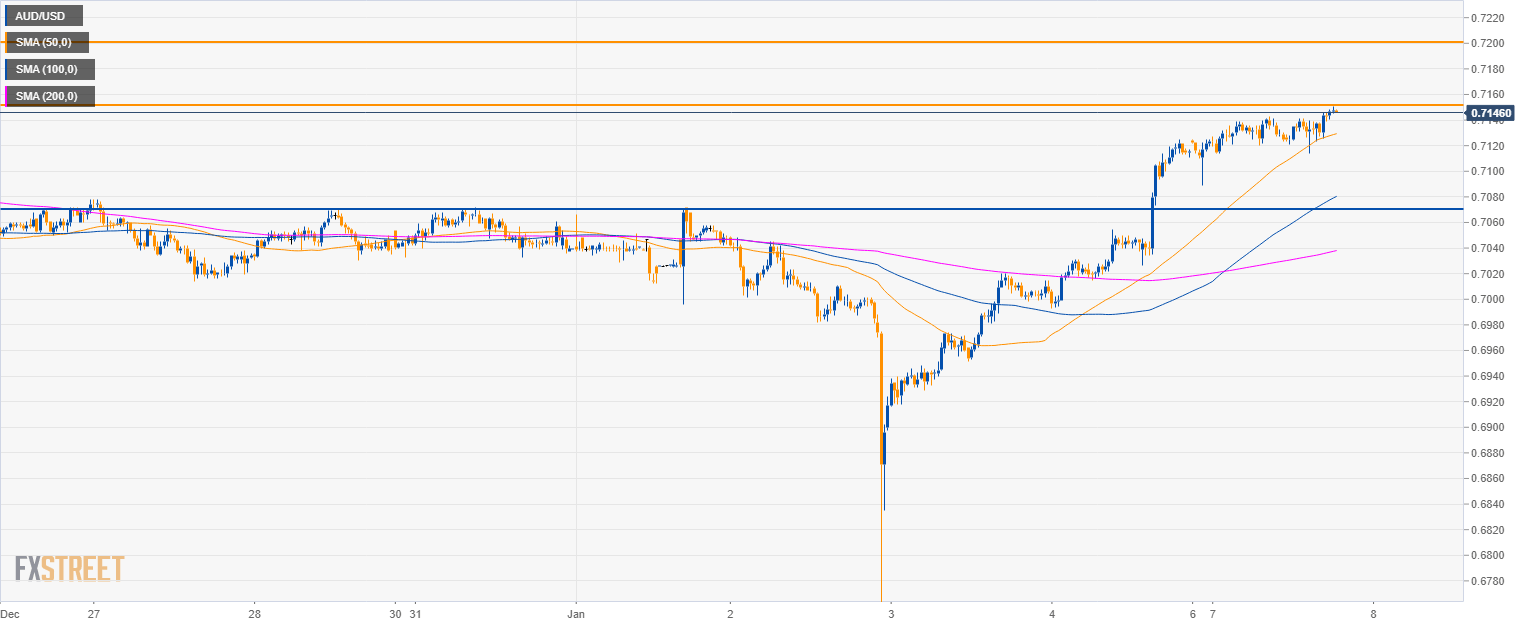
AUD/USD 30-minute chart
- AUD/USD is trading above its main SMAs suggesting bullish momentum in the short-term.
- Bulls would need to overcome 0.7150 and 0.7200 resistances.
- Since the main trend is bearish, sellers might come back and bring the market to 0.7070 support.
Additional key levels
AUD/USD
Overview:
Today Last Price: 0.7149
Today Daily change: 33 pips
Today Daily change %: 0.464%
Today Daily Open: 0.7116
Trends:
Previous Daily SMA20: 0.7104
Previous Daily SMA50: 0.7184
Previous Daily SMA100: 0.7185
Previous Daily SMA200: 0.7344
Levels:
Previous Daily High: 0.7125
Previous Daily Low: 0.6993
Previous Weekly High: 0.7125
Previous Weekly Low: 0.6684
Previous Monthly High: 0.7394
Previous Monthly Low: 0.7014
Previous Daily Fibonacci 38.2%: 0.7075
Previous Daily Fibonacci 61.8%: 0.7043
Previous Daily Pivot Point S1: 0.7031
Previous Daily Pivot Point S2: 0.6946
Previous Daily Pivot Point S3: 0.6899
Previous Daily Pivot Point R1: 0.7163
Previous Daily Pivot Point R2: 0.721
Previous Daily Pivot Point R3: 0.7295
