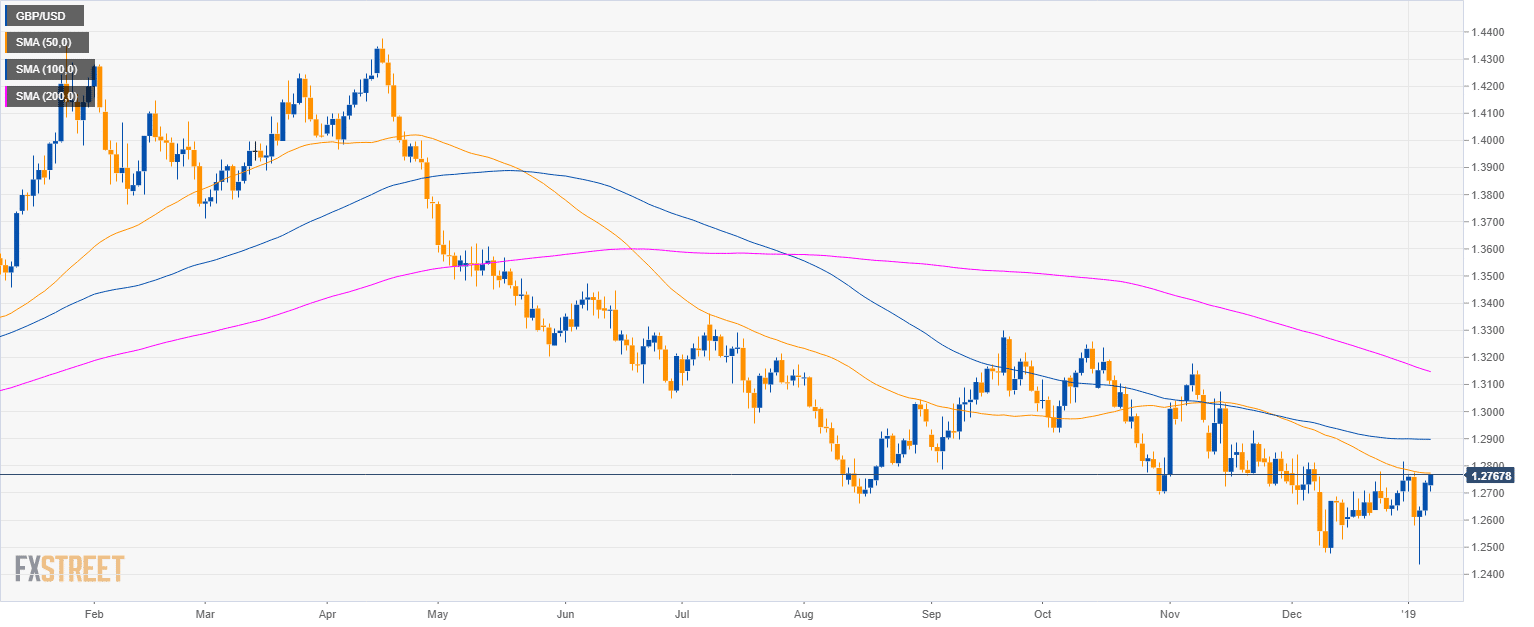
GBP/USD daily chart
- GBP/USD is trading in a bear trend below the 200 SMA.
- GBP/USD is currently testing the 50 SMA near the 1.2800 figure.
GBP/USD 4-hour chart
- GBP/USD is challenging the January highs.

GBP/USD daily chart
- GBP/USD is trading above the main SMAs suggesting current bullish momentum.
- Resistance to the upside can be seen near 1.2800 the figure while to the downside 1.2700 and 1.2560 act as support.

Additional key levels
GBP/USD
Overview:
Today Last Price: 1.2771
Today Daily change: 33 pips
Today Daily change %: 0.259%
Today Daily Open: 1.2738
Trends:
Previous Daily SMA20: 1.265
Previous Daily SMA50: 1.2773
Previous Daily SMA100: 1.2898
Previous Daily SMA200: 1.3155
Levels:
Previous Daily High: 1.2746
Previous Daily Low: 1.2615
Previous Weekly High: 1.2815
Previous Weekly Low: 1.2438
Previous Monthly High: 1.284
Previous Monthly Low: 1.2477
Previous Daily Fibonacci 38.2%: 1.2696
Previous Daily Fibonacci 61.8%: 1.2665
Previous Daily Pivot Point S1: 1.2653
Previous Daily Pivot Point S2: 1.2569
Previous Daily Pivot Point S3: 1.2523
Previous Daily Pivot Point R1: 1.2784
Previous Daily Pivot Point R2: 1.283
Previous Daily Pivot Point R3: 1.2914
