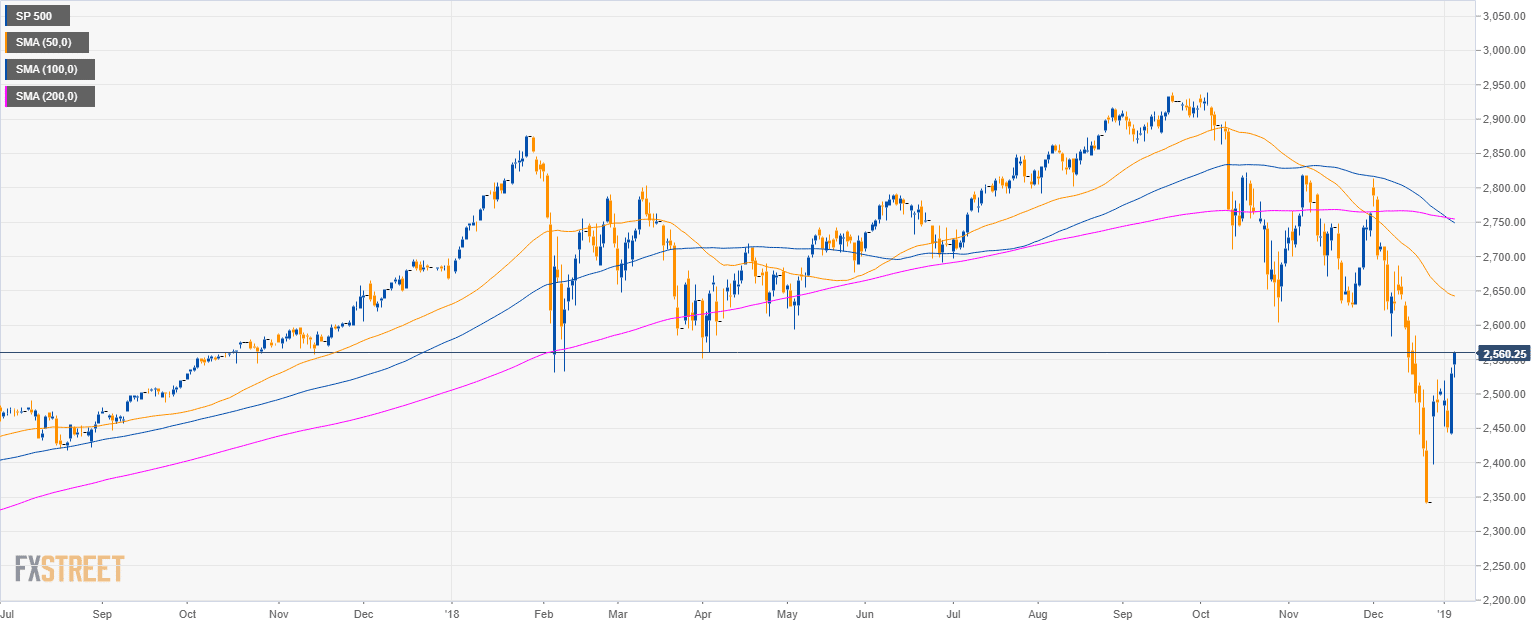
S&P500 daily chart
- The S&P500 is having a deep pullback below the 50, 100 and 200-period simple moving averages (SMAs).
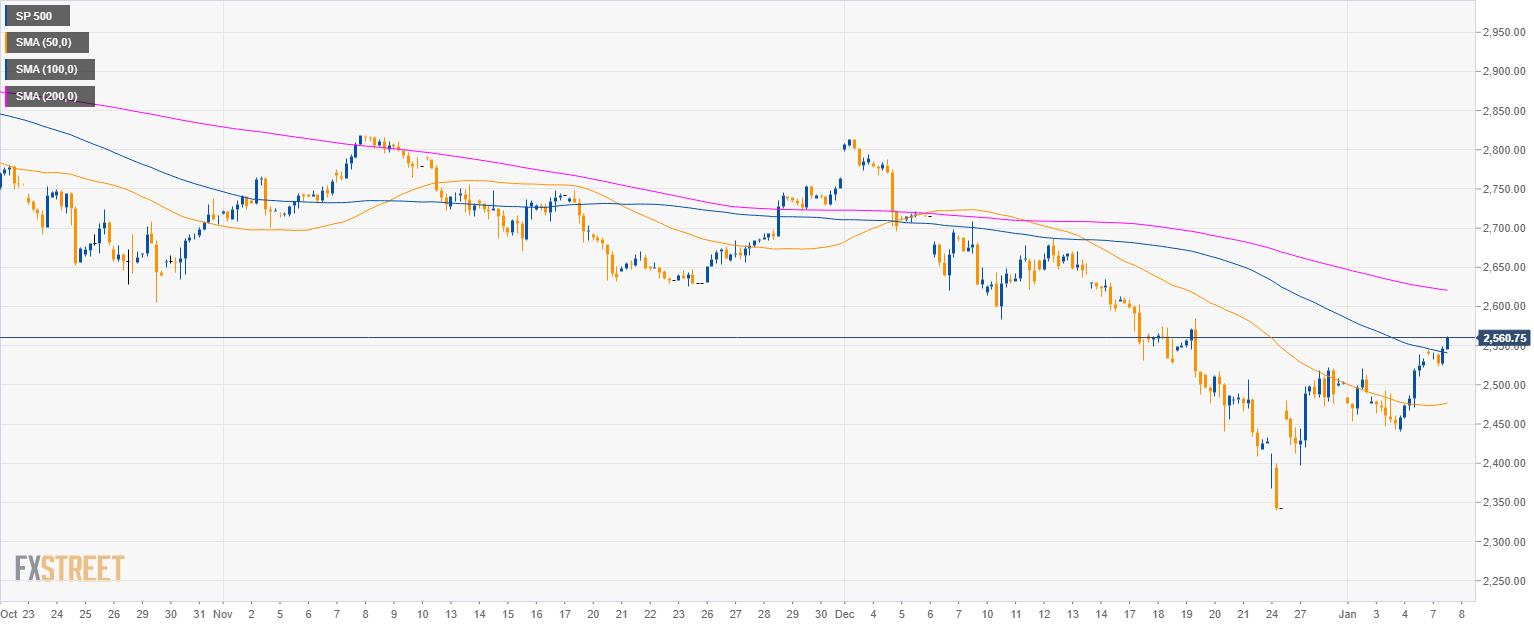
S&P500 4-hour chart
- The S&P500 is breaking above the 2,500.00 figure and the 50 SMA.
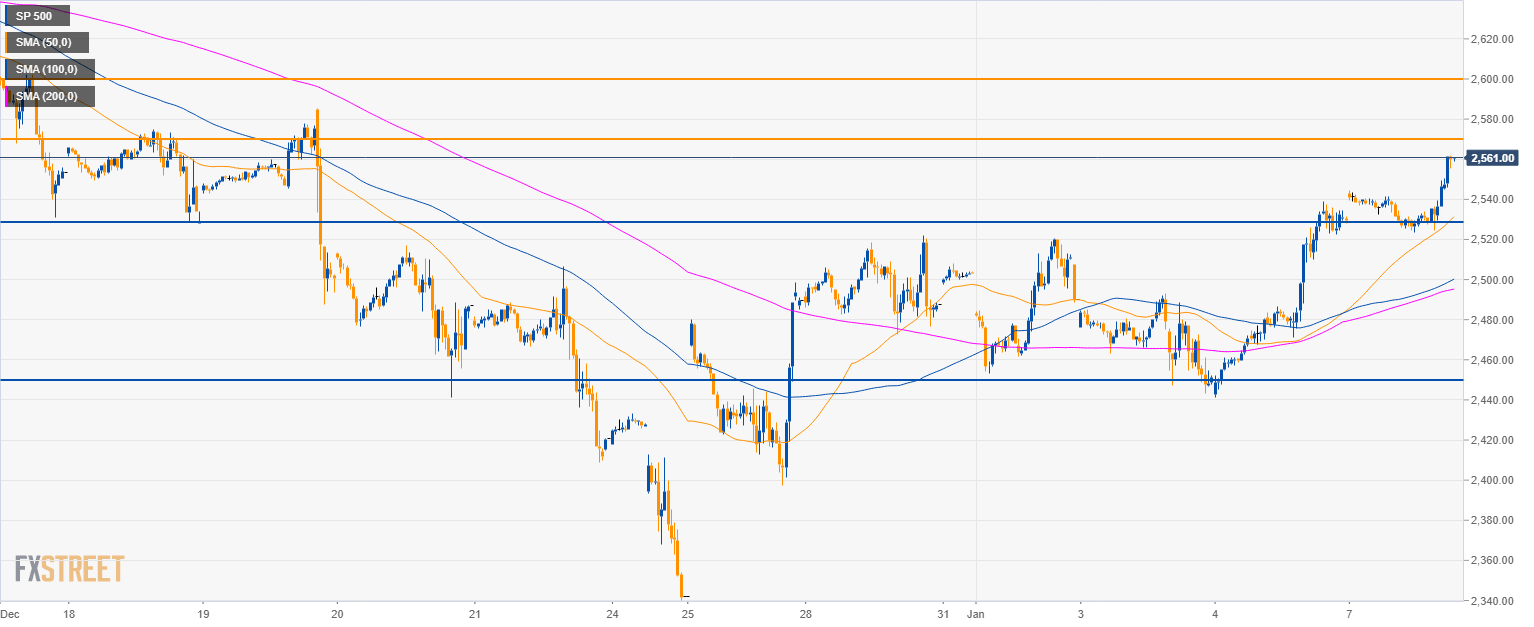
S&P500 30-minute chart
- A break of the 2,570.00 level would open the gates to 2,600.00 resistance.
Additional key levels
SP 500
Overview:
Today Last Price: 2560
Today Daily change: 3.1e+3 pips
Today Daily change %: 1.21%
Today Daily Open: 2529.5
Trends:
Previous Daily SMA20: 2531.04
Previous Daily SMA50: 2644.25
Previous Daily SMA100: 2752.17
Previous Daily SMA200: 2755.39
Levels:
Previous Daily High: 2539
Previous Daily Low: 2441
Previous Weekly High: 2539
Previous Weekly Low: 2441
Previous Monthly High: 2813.5
Previous Monthly Low: 2340.25
Previous Daily Fibonacci 38.2%: 2501.56
Previous Daily Fibonacci 61.8%: 2478.44
Previous Daily Pivot Point S1: 2467.33
Previous Daily Pivot Point S2: 2405.17
Previous Daily Pivot Point S3: 2369.33
Previous Daily Pivot Point R1: 2565.33
Previous Daily Pivot Point R2: 2601.17
Previous Daily Pivot Point R3: 2663.33
