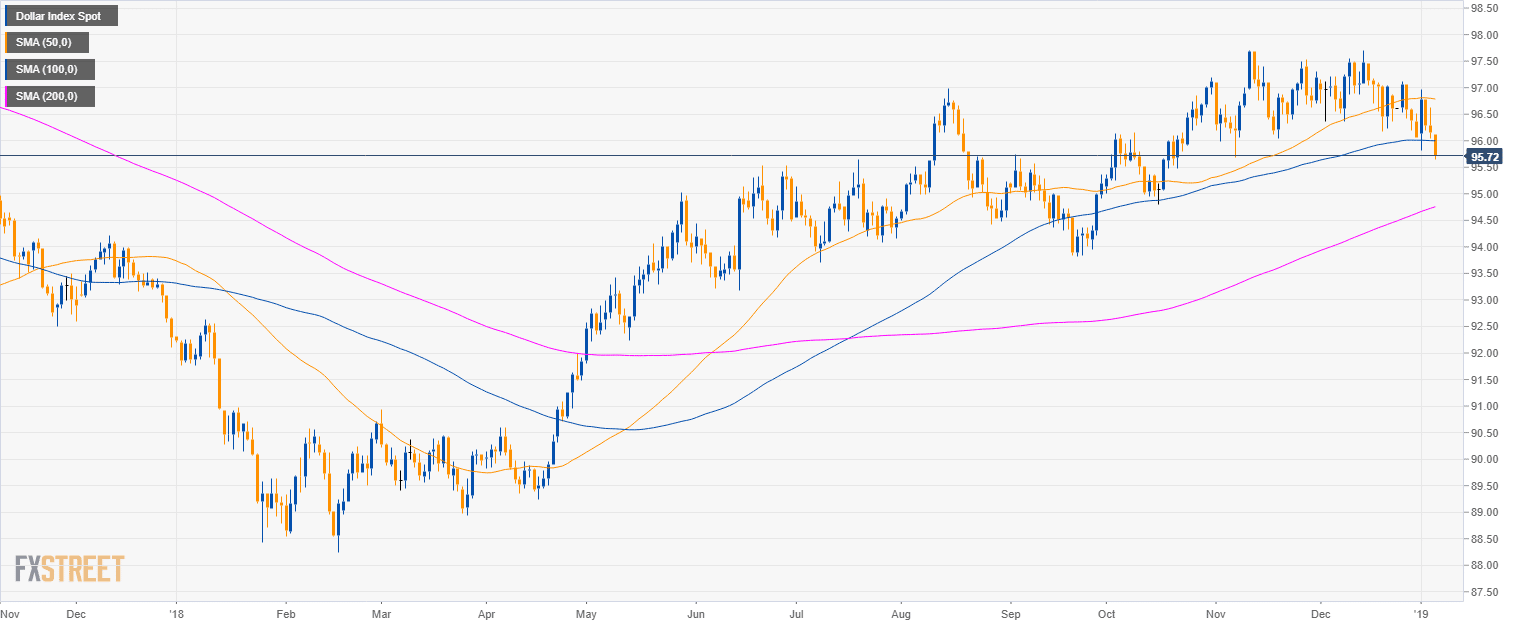
DXY daily chart
- The US Dollar Index (DXY) is trading in a bull trend above the 50, 100 and 200-period simple moving averages (SMAs).
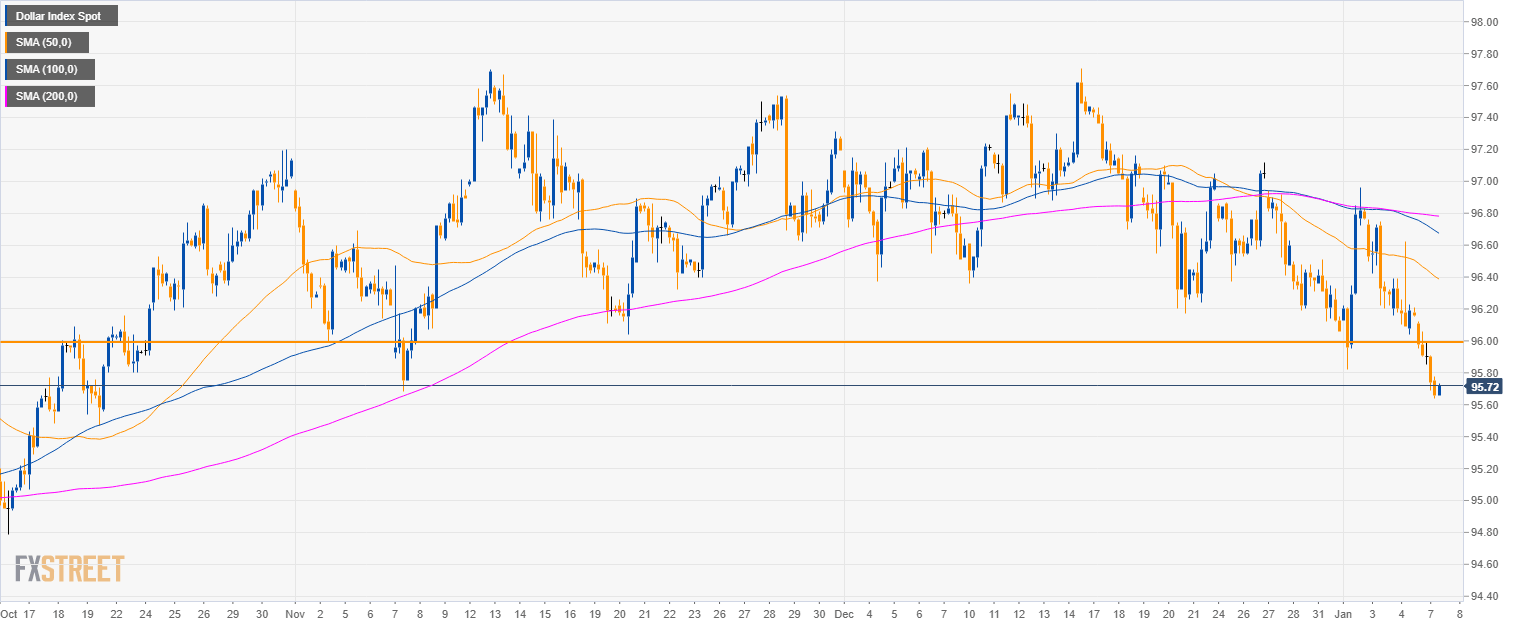
DXY 4-hour chart
- DXY broke below the 96.00 figure.
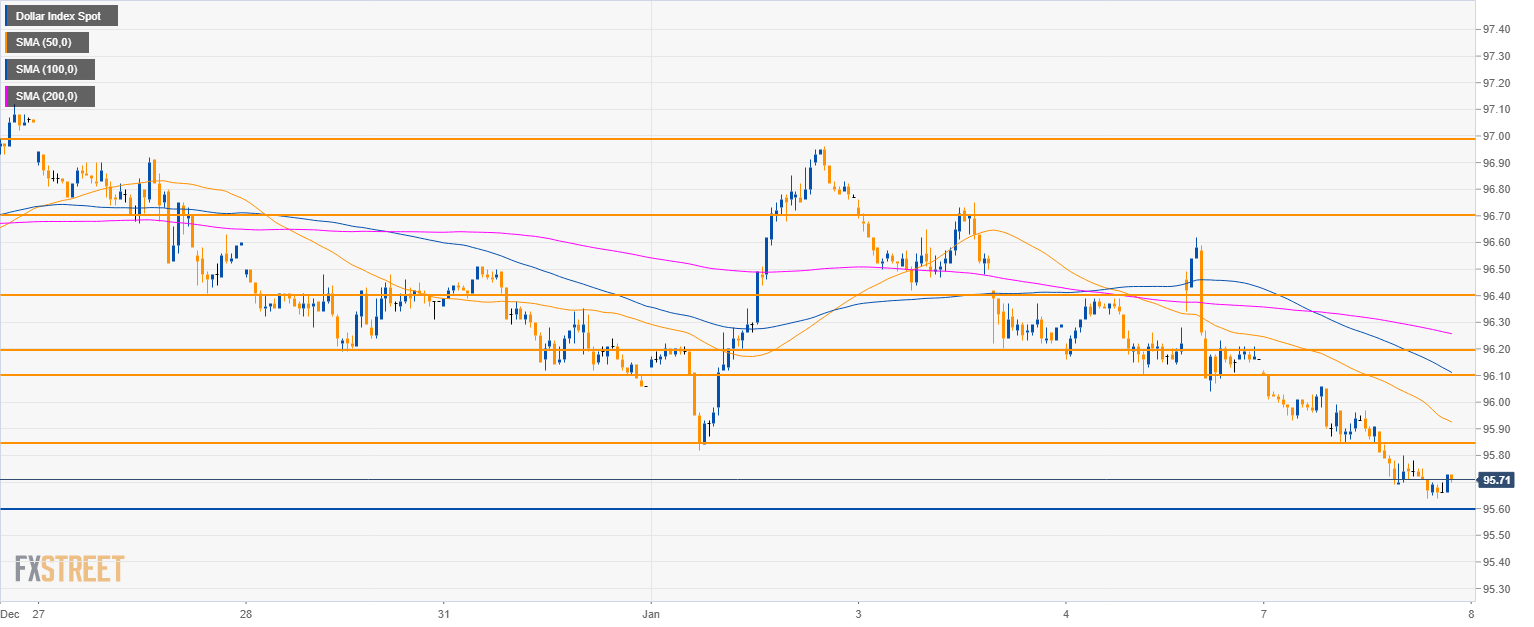
DXY 30-minute chart
- DXY is trading below its main SMAs suggesting bearish momentum in the short-term.
- 95.60 is the level to beat for bears. A breach of the level would open the door to 95.30.
- To the upside 96.10 and 96.20 are the first main targets. Bulls are likely to be in charge in the coming sessions.
Additional key levels
Dollar Index Spot
Overview:
Today Last Price: 95.73
Today Daily change: -43 pips
Today Daily change %: -0.447%
Today Daily Open: 96.16
Trends:
Previous Daily SMA20: 96.8
Previous Daily SMA50: 96.8
Previous Daily SMA100: 96
Previous Daily SMA200: 94.73
Levels:
Previous Daily High: 96.62
Previous Daily Low: 96.04
Previous Weekly High: 96.96
Previous Weekly Low: 95.82
Previous Monthly High: 97.71
Previous Monthly Low: 96.06
Previous Daily Fibonacci 38.2%: 96.26
Previous Daily Fibonacci 61.8%: 96.4
Previous Daily Pivot Point S1: 95.93
Previous Daily Pivot Point S2: 95.69
Previous Daily Pivot Point S3: 95.35
Previous Daily Pivot Point R1: 96.51
Previous Daily Pivot Point R2: 96.85
Previous Daily Pivot Point R3: 97.09
