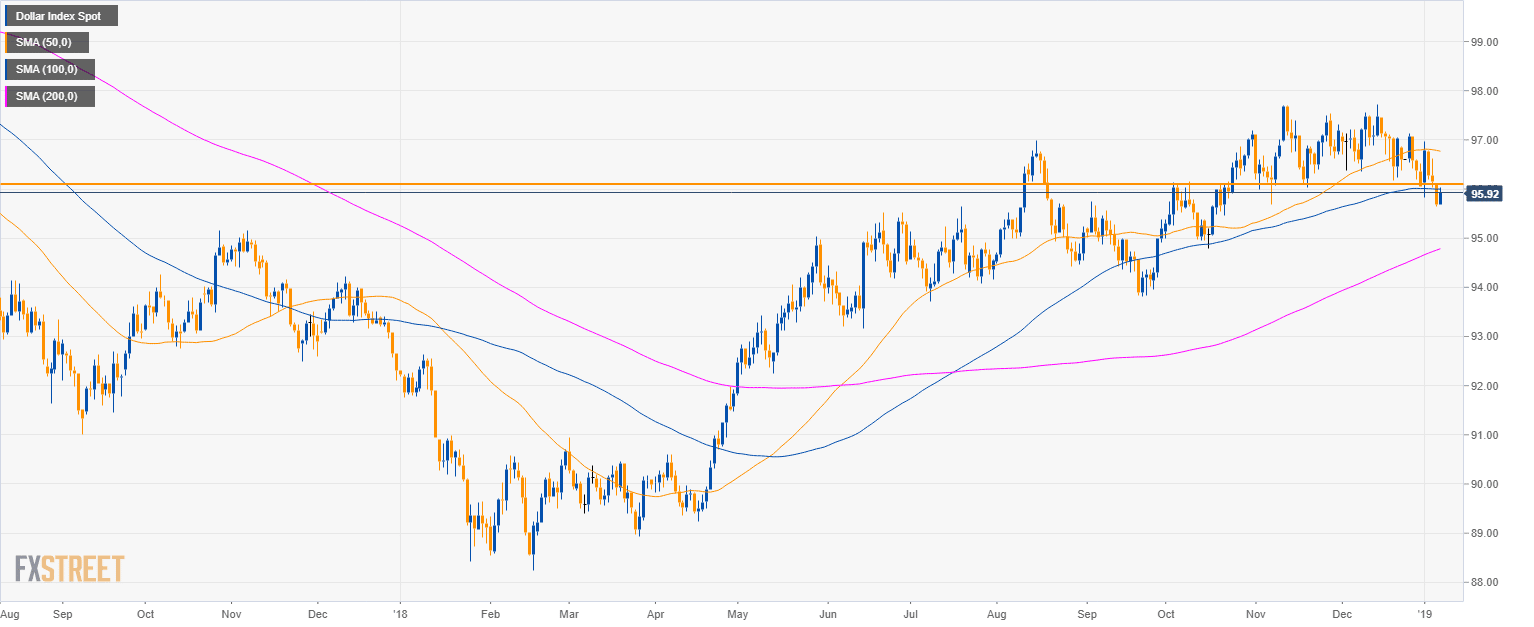
DXY daily chart
- The US Dollar Index (DXY) is trading in a bull trend above the 200-period simple moving average (SMA).
- Bears broke below the 100 SMA.
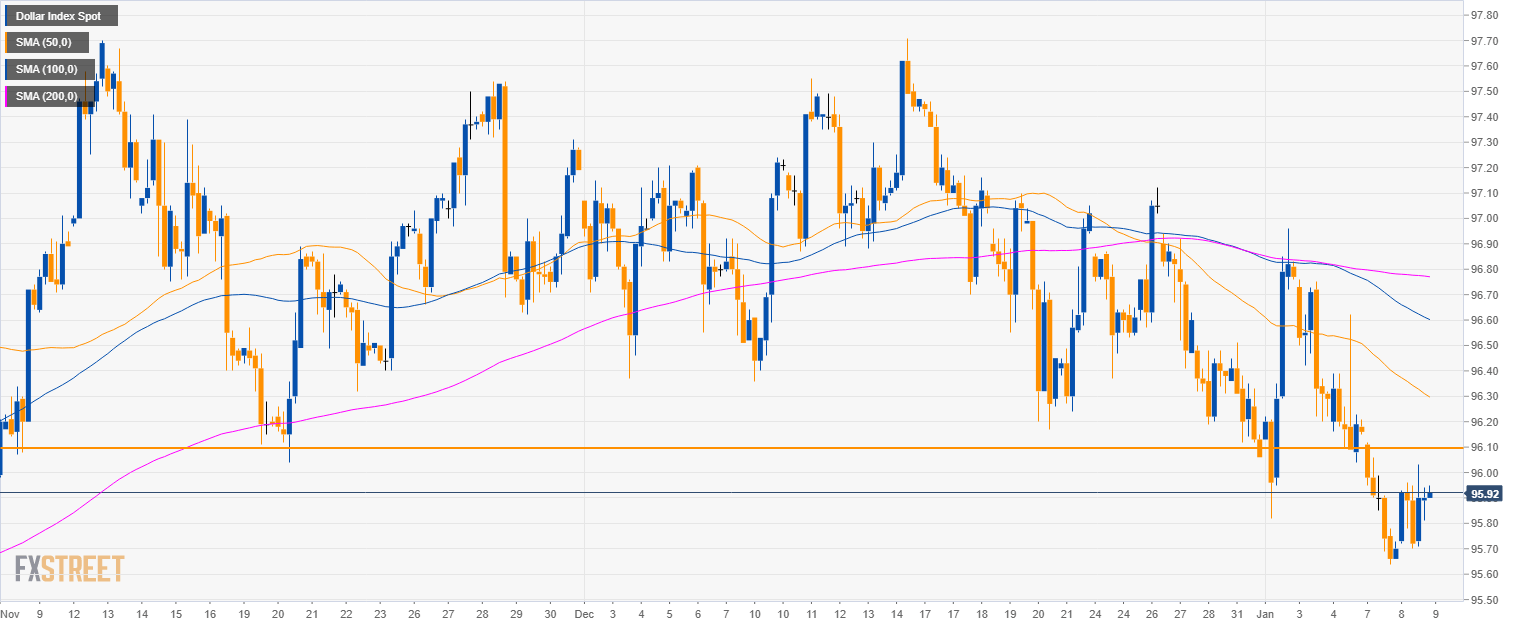
DXY 4-hour chart
- DXY broke below the 96.00 figure.
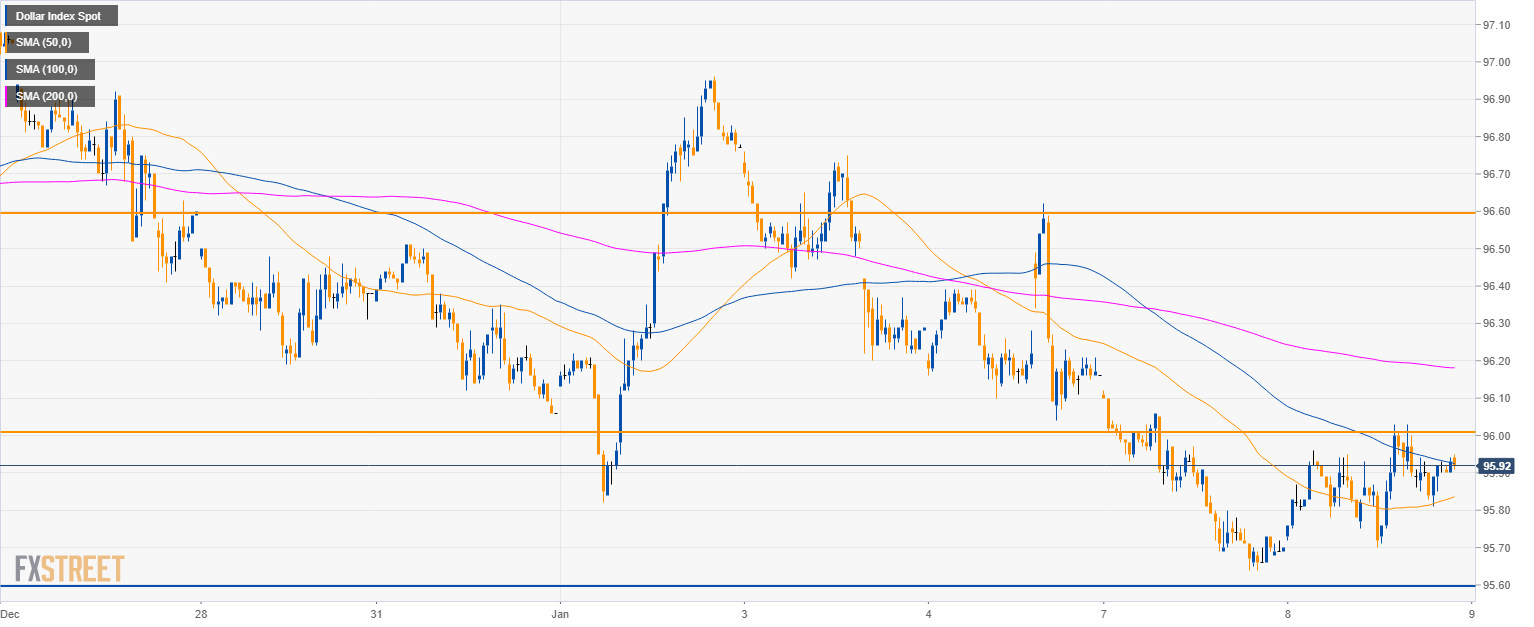
DXY 30-minute chart
- DXY reclaimed the 50 SMA and is now challenging the 100 SMA.
- As bulls are coming back a break above 96.00 would open the gates to 96.60.
- On the flip side, 95.60 is the level to beat for bears. A breach of the level would open the door to 95.30.
Additional key levels
Dollar Index Spot
Overview:
Today Last Price: 95.92
Today Daily change: 23 pips
Today Daily change %: 0.240%
Today Daily Open: 95.69
Trends:
Previous Daily SMA20: 96.76
Previous Daily SMA50: 96.79
Previous Daily SMA100: 96
Previous Daily SMA200: 94.76
Levels:
Previous Daily High: 96.12
Previous Daily Low: 95.64
Previous Weekly High: 96.96
Previous Weekly Low: 95.82
Previous Monthly High: 97.71
Previous Monthly Low: 96.06
Previous Daily Fibonacci 38.2%: 95.82
Previous Daily Fibonacci 61.8%: 95.94
Previous Daily Pivot Point S1: 95.51
Previous Daily Pivot Point S2: 95.34
Previous Daily Pivot Point S3: 95.03
Previous Daily Pivot Point R1: 95.99
Previous Daily Pivot Point R2: 96.3
Previous Daily Pivot Point R3: 96.47
