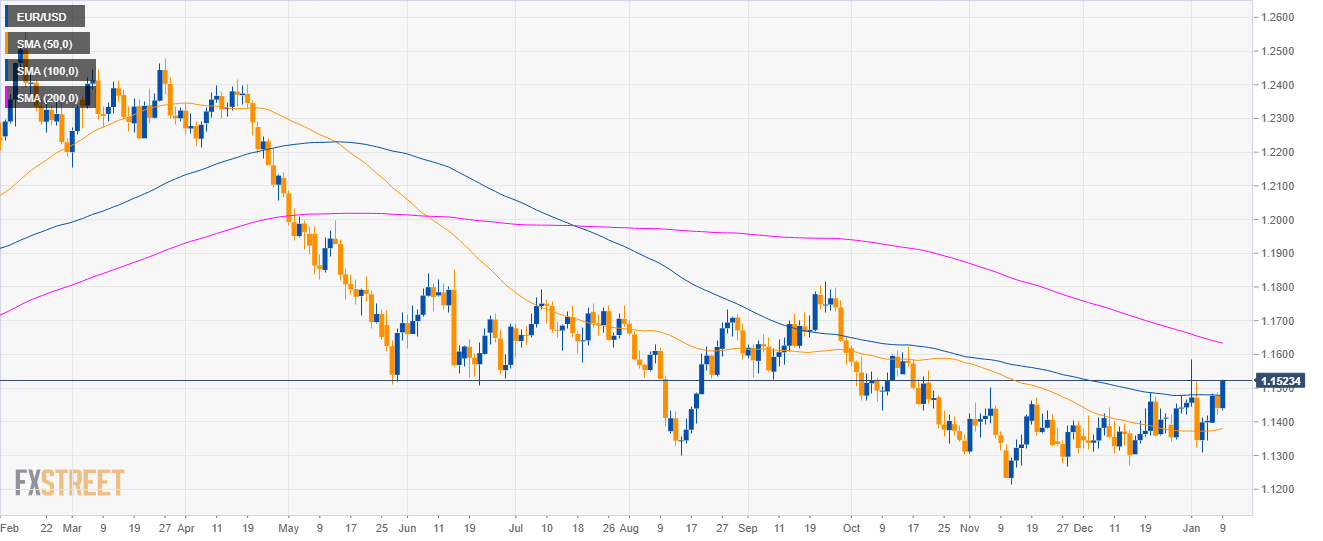
EUR/USD daily chart
- EUR/USD is trading in a bear trend below the 200 SMA.
- EUR/USD is breaking above the 100 SMA as Fed’s Bostic is open to cutting rates.
- The FOMC minutes scheduled at 19:00 GMT will most likely provide volatility in the forex market.
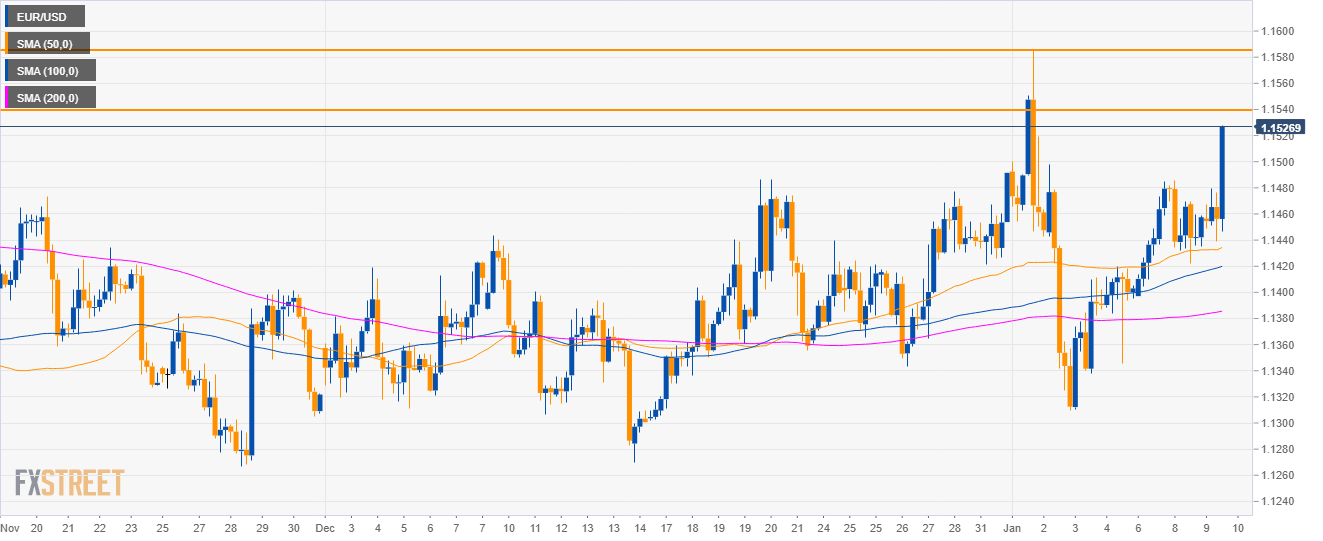
EUR/USD 4-hour chart
- EUR/USD is nearing 1.1540 resistance.
EUR/USD 30-minute chart
- Bulls are trying to generate a breakout as they strongly broke above the 1.1500 figure. The next hurdle to overcome is the 1.1540 resistance.
- Since the main trend is bearish sellers might come back soon with targets to the downside seen near 1.1410 and the 1.1350 level.

Additional key levels
Dollar Index Spot
Overview:
Today Last Price: 95.35
Today Daily change: -57 pips
Today Daily change %: -0.594%
Today Daily Open: 95.92
Trends:
Previous Daily SMA20: 96.69
Previous Daily SMA50: 96.77
Previous Daily SMA100: 96
Previous Daily SMA200: 94.79
Levels:
Previous Daily High: 96.03
Previous Daily Low: 95.69
Previous Weekly High: 96.96
Previous Weekly Low: 95.82
Previous Monthly High: 97.71
Previous Monthly Low: 96.06
Previous Daily Fibonacci 38.2%: 95.9
Previous Daily Fibonacci 61.8%: 95.82
Previous Daily Pivot Point S1: 95.73
Previous Daily Pivot Point S2: 95.54
Previous Daily Pivot Point S3: 95.39
Previous Daily Pivot Point R1: 96.07
Previous Daily Pivot Point R2: 96.22
Previous Daily Pivot Point R3: 96.41
