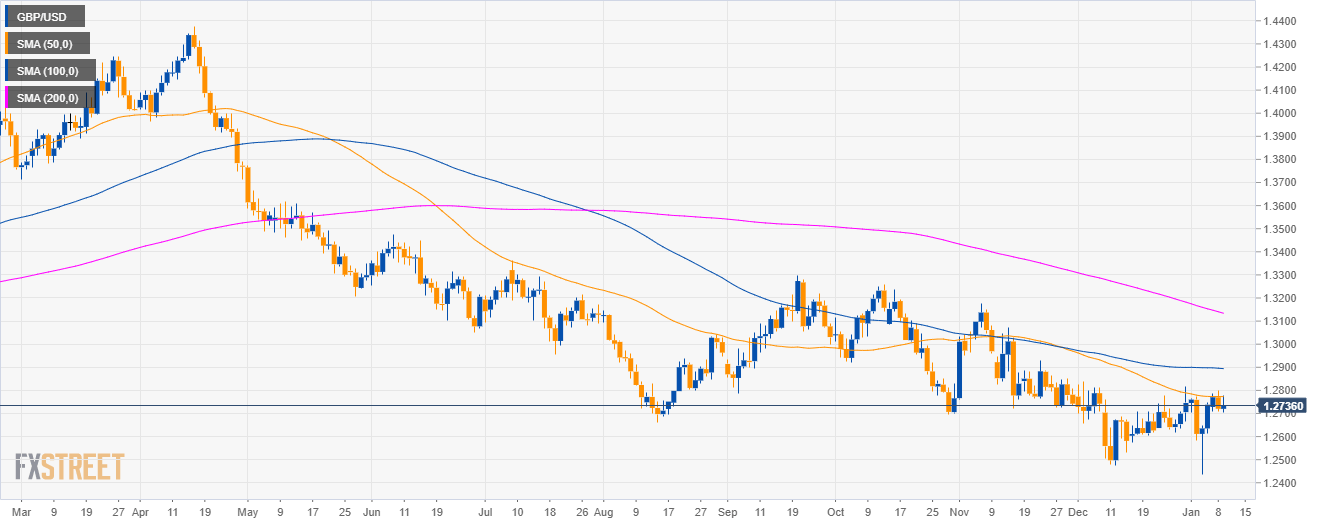
GBP/USD daily chart
- GBP/USD is evolving in a bear trend below the 200 SMA.
- GBP/USD rejected the 50 SMA.
- The FOMC minutes at 19:00 GMT will likely provide volatility in the forex market.
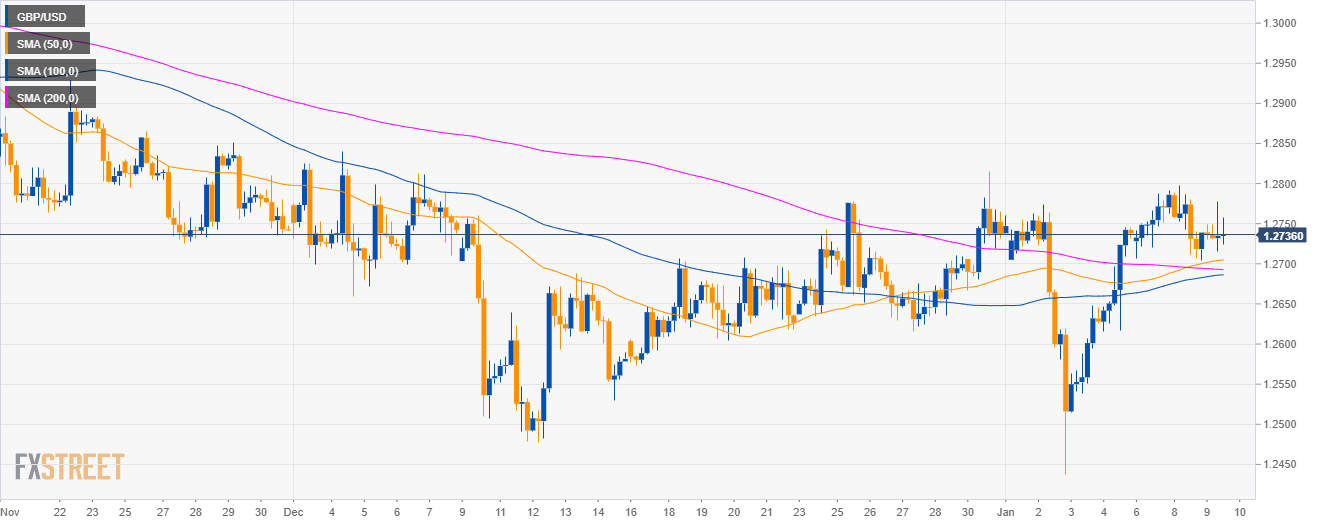
GBP/USD 4-hour chart
- GBP/USD is rejecting the December and January highs as it is having a hard time to pierce the 1.2800 figure.
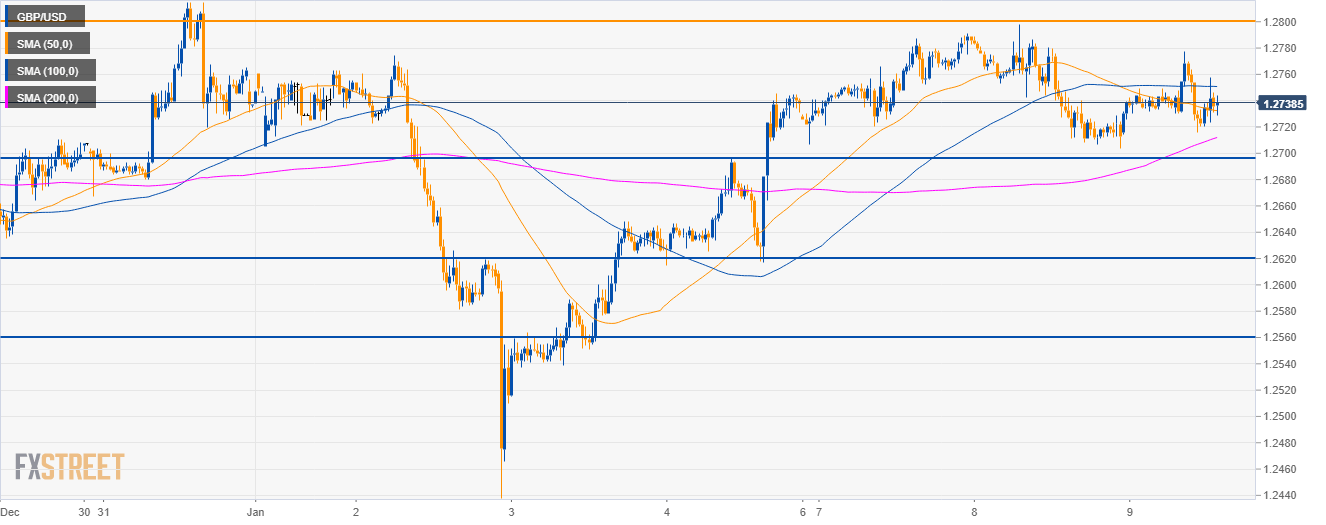
GBP/USD 30-minute chart
- Bears broke below the 100 SMA.
- A break below 1.2700 should open the way to the 1.2620 level.
Additional key levels
GBP/USD
Overview:
Today Last Price: 1.2738
Today Daily change: 18 pips
Today Daily change %: 0.142%
Today Daily Open: 1.272
Trends:
Previous Daily SMA20: 1.2672
Previous Daily SMA50: 1.2773
Previous Daily SMA100: 1.2896
Previous Daily SMA200: 1.3143
Levels:
Previous Daily High: 1.2798
Previous Daily Low: 1.2706
Previous Weekly High: 1.2815
Previous Weekly Low: 1.2438
Previous Monthly High: 1.284
Previous Monthly Low: 1.2477
Previous Daily Fibonacci 38.2%: 1.2741
Previous Daily Fibonacci 61.8%: 1.2763
Previous Daily Pivot Point S1: 1.2685
Previous Daily Pivot Point S2: 1.265
Previous Daily Pivot Point S3: 1.2594
Previous Daily Pivot Point R1: 1.2777
Previous Daily Pivot Point R2: 1.2833
Previous Daily Pivot Point R3: 1.2868
