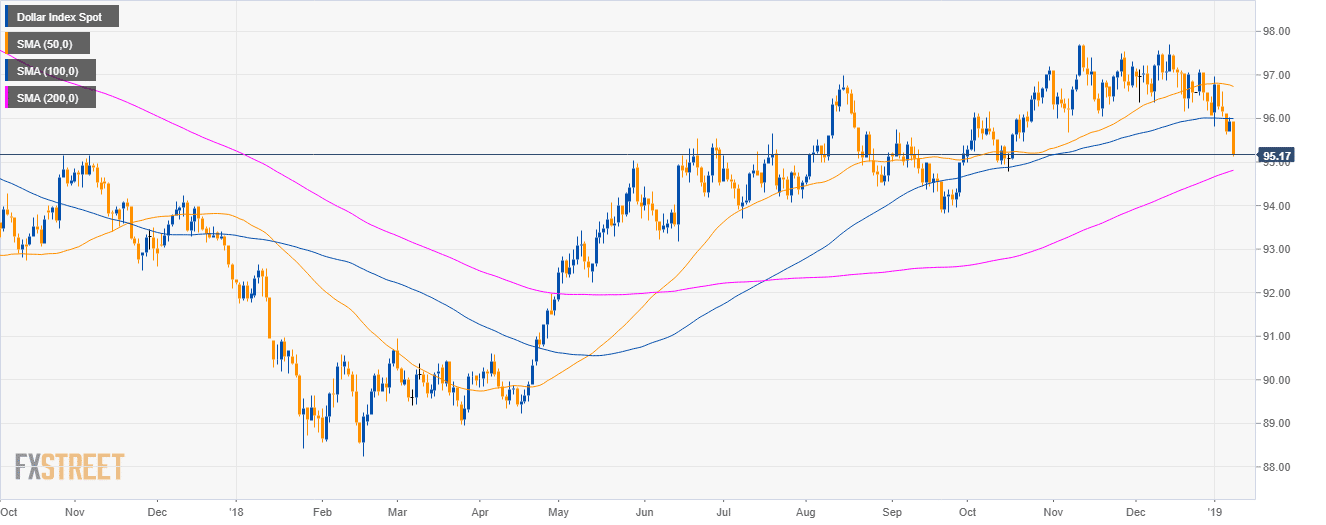
DXY daily chart
- The US Dollar Index (DXY) is evolving in a bull trend above the 200 SMA.
- DXY broke below the 100 SMA and the 96.00 figure.
- The dovish FOMC minutes didn’t have a significant impact on the currency market.
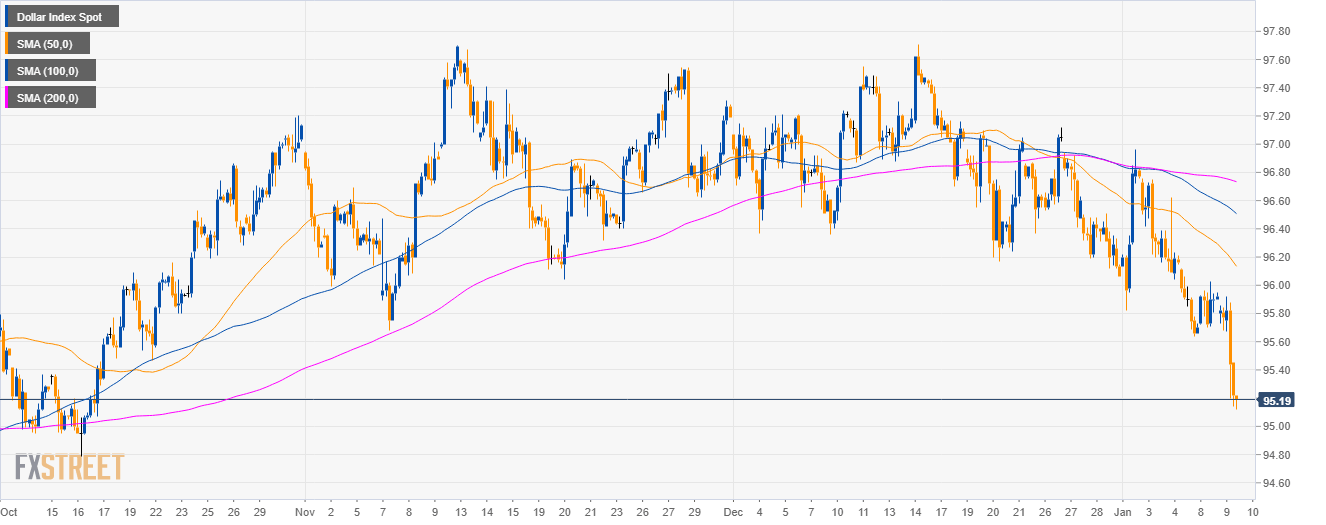
DXY 4-hour chart
- DXY is now holding above the 95.00 figure, its lowest point in more than 2 months.
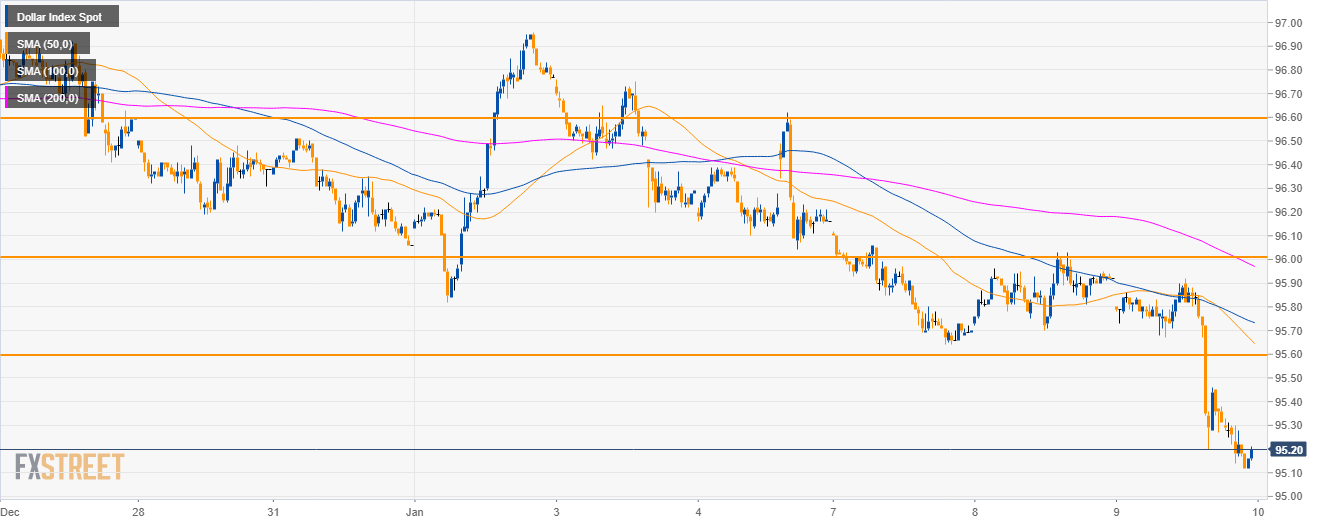
DXY 30-minute chart
- The US Dollar sell-off might have run its course and bulls are expected to come back and drive the market to 95.60 and 96.00 if they gather enough steam.
Additional key levels
Dollar Index Spot
Overview:
Today Last Price: 95.19
Today Daily change: -73 pips
Today Daily change %: -0.761%
Today Daily Open: 95.92
Trends:
Previous Daily SMA20: 96.69
Previous Daily SMA50: 96.77
Previous Daily SMA100: 96
Previous Daily SMA200: 94.79
Levels:
Previous Daily High: 96.03
Previous Daily Low: 95.69
Previous Weekly High: 96.96
Previous Weekly Low: 95.82
Previous Monthly High: 97.71
Previous Monthly Low: 96.06
Previous Daily Fibonacci 38.2%: 95.9
Previous Daily Fibonacci 61.8%: 95.82
Previous Daily Pivot Point S1: 95.73
Previous Daily Pivot Point S2: 95.54
Previous Daily Pivot Point S3: 95.39
Previous Daily Pivot Point R1: 96.07
Previous Daily Pivot Point R2: 96.22
Previous Daily Pivot Point R3: 96.41
