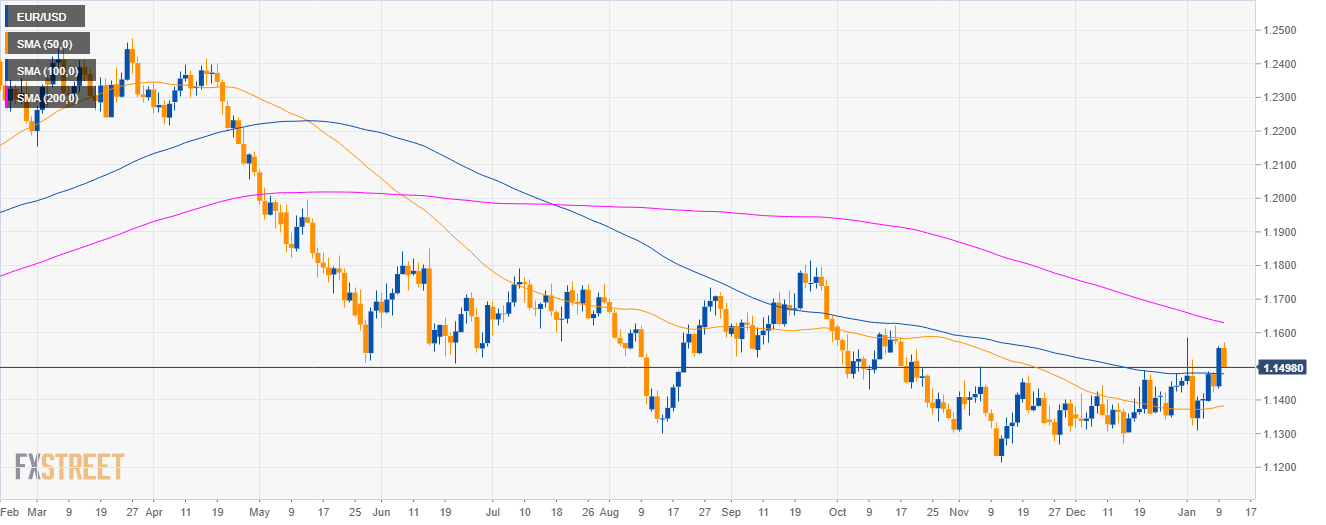
EUR/USD Daily chart
- EUR/USD is in a bear trend below the 200-period simple moving average (SMA).
- EUR/USD is testing the 1.1500 figure as Fed’s Powell is speaking at the Economic Club of Washington, D.C.
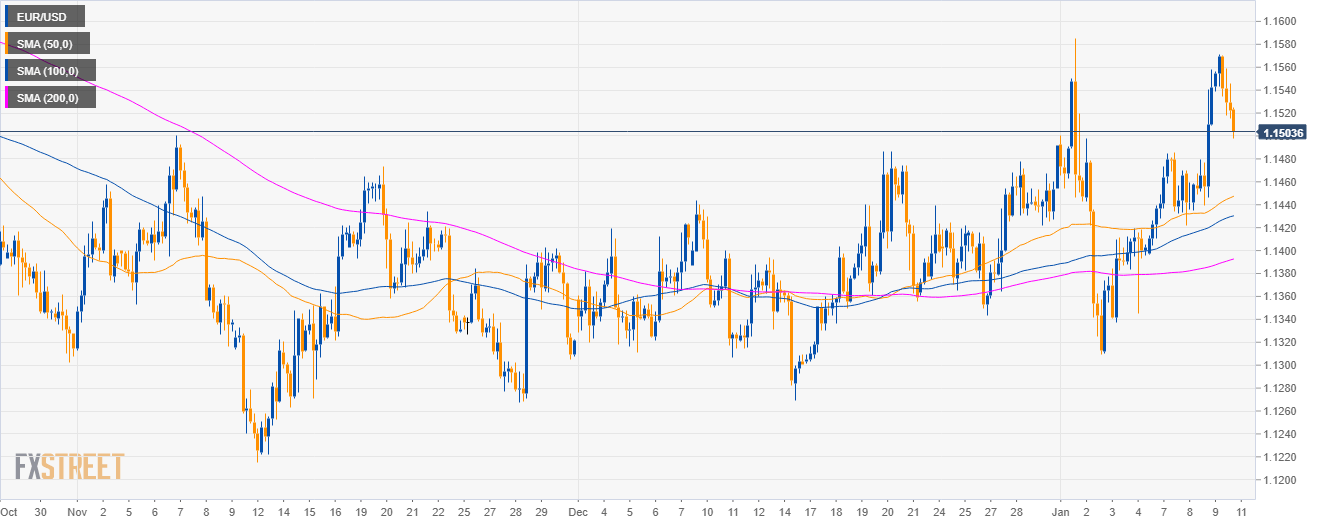
EUR/USD 4-hour chart
- EUR/USD is trading above its main SMAs as bulls challenged the 2019 high.
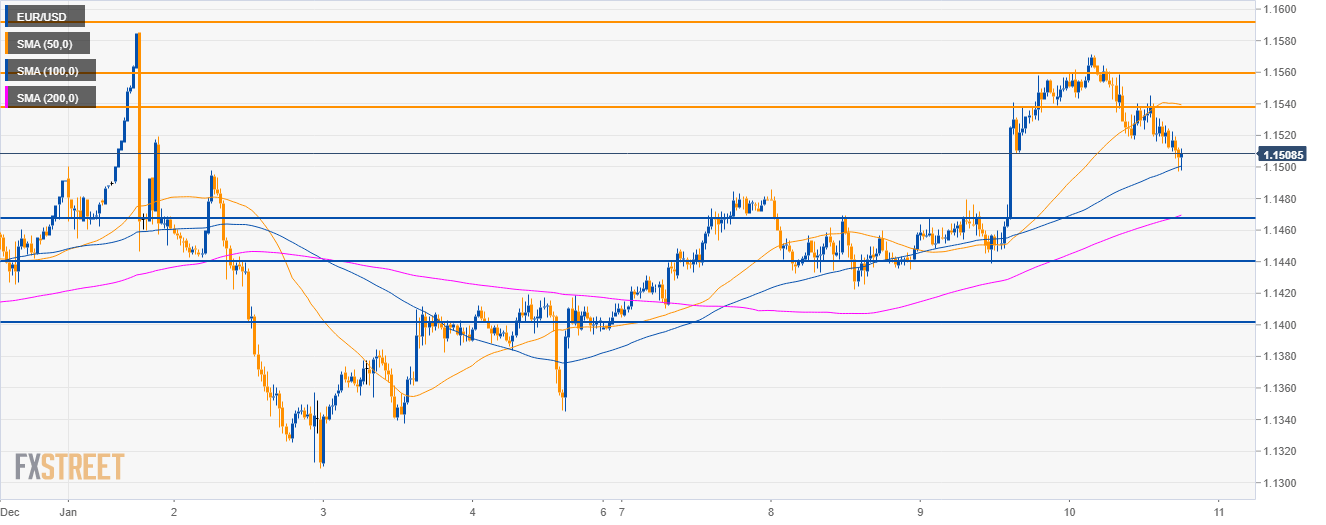
EUR/USD 30-minute chart
- The 1.1540 and 1.1560 resistances are currently capping bullish advances as traders are testing the 100 SMA.
- If EUR/USD bears are able to break below 1.1470 they could drive the market to 1.1440 and 1.1400 in the near future.
Additional key levels
EUR/USD
Overview:
Today Last Price: 1.1506
Today Daily change: -48 pips
Today Daily change %: -0.415%
Today Daily Open: 1.1554
Trends:
Previous Daily SMA20: 1.1408
Previous Daily SMA50: 1.1381
Previous Daily SMA100: 1.1478
Previous Daily SMA200: 1.1635
Levels:
Previous Daily High: 1.1558
Previous Daily Low: 1.1435
Previous Weekly High: 1.1586
Previous Weekly Low: 1.1309
Previous Monthly High: 1.1486
Previous Monthly Low: 1.1269
Previous Daily Fibonacci 38.2%: 1.1511
Previous Daily Fibonacci 61.8%: 1.1482
Previous Daily Pivot Point S1: 1.1473
Previous Daily Pivot Point S2: 1.1392
Previous Daily Pivot Point S3: 1.135
Previous Daily Pivot Point R1: 1.1597
Previous Daily Pivot Point R2: 1.1639
Previous Daily Pivot Point R3: 1.172
