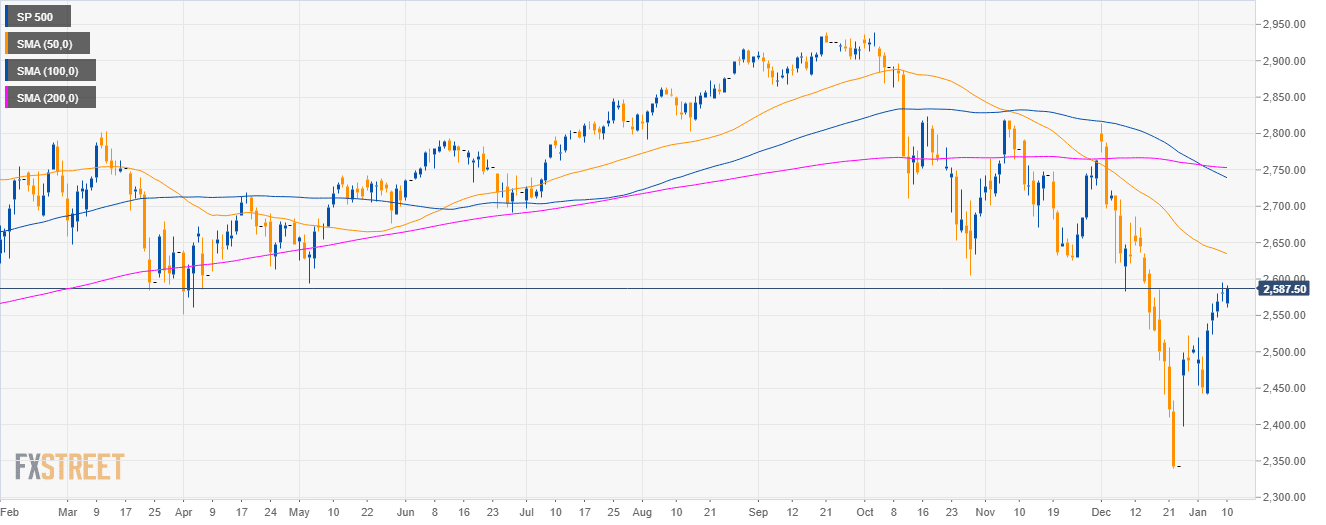
S&P500 Daily chart
- The S&P500 is having a deep pullback below the 200-period simple moving average (SMA).
- Fed’s Powell speech today at 17.45 GMT can lead to high volatility.
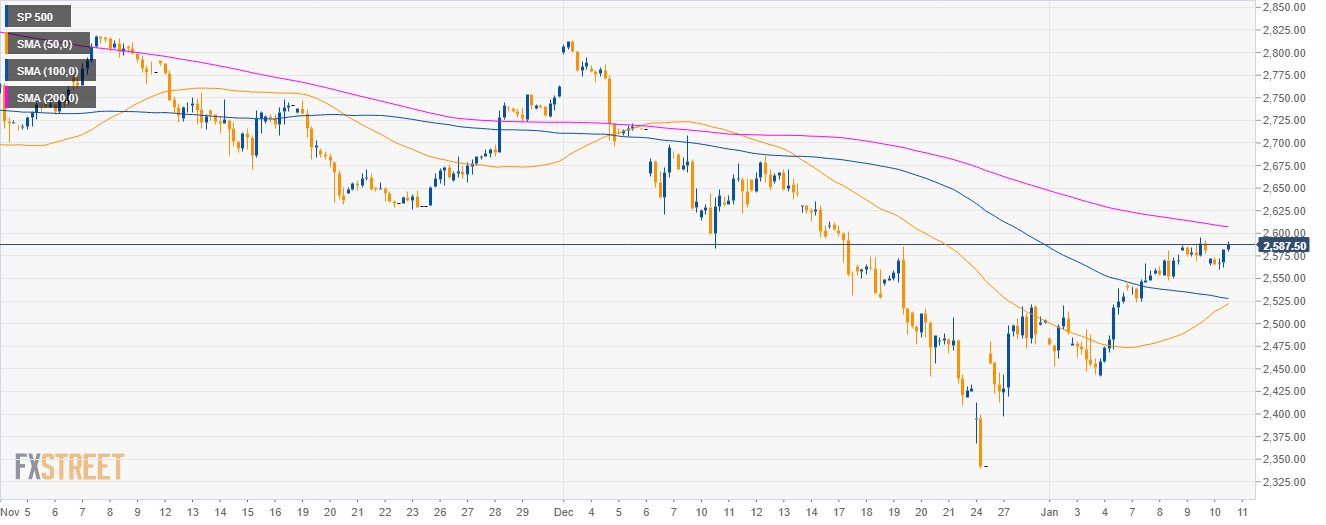
S&P500 4-hour chart
- Bulls reclaimed the 50 and 100 SMAs but need to overcome the 200 SMA for further advances.
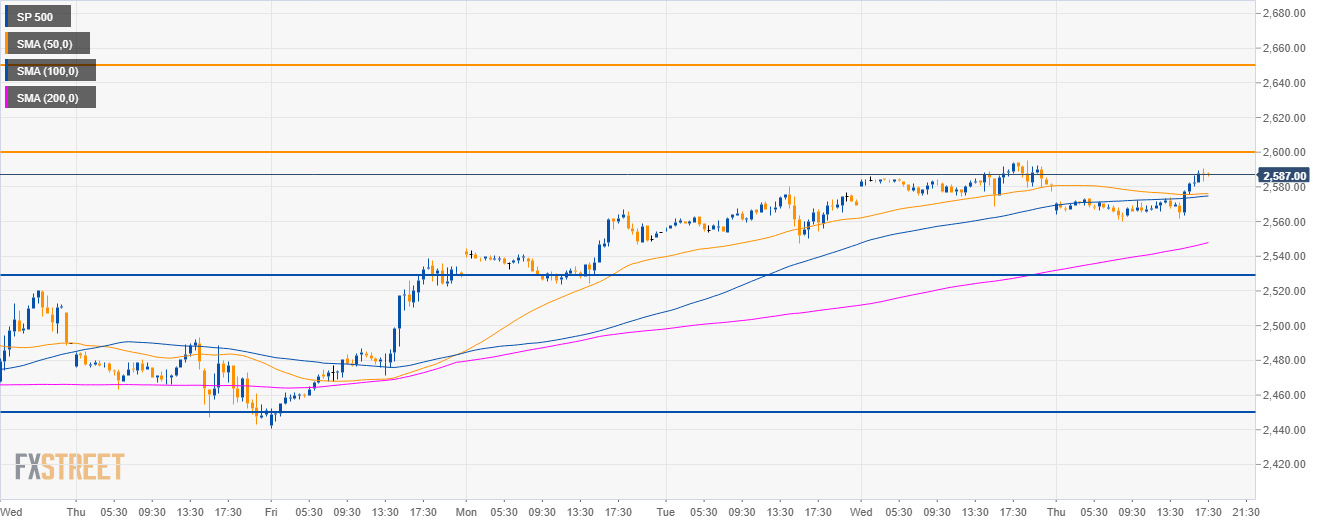
S&P500 30-minute chart
- The S&P500 is trading above its main SMAs suggesting bullish momentum.
- A break of the 2,600.00 resistance can lead to a run to the 2,650.00 level.
Additional key levels
SP 500
Overview:
Today Last Price: 2587.25
Today Daily change: 6.3e+2 pips
Today Daily change %: 0.242%
Today Daily Open: 2581
Trends:
Previous Daily SMA20: 2517.7
Previous Daily SMA50: 2637.53
Previous Daily SMA100: 2742.47
Previous Daily SMA200: 2753.54
Levels:
Previous Daily High: 2595.5
Previous Daily Low: 2568.5
Previous Weekly High: 2539
Previous Weekly Low: 2441
Previous Monthly High: 2813.5
Previous Monthly Low: 2340.25
Previous Daily Fibonacci 38.2%: 2585.19
Previous Daily Fibonacci 61.8%: 2578.81
Previous Daily Pivot Point S1: 2567.83
Previous Daily Pivot Point S2: 2554.67
Previous Daily Pivot Point S3: 2540.83
Previous Daily Pivot Point R1: 2594.83
Previous Daily Pivot Point R2: 2608.67
Previous Daily Pivot Point R3: 2621.83
