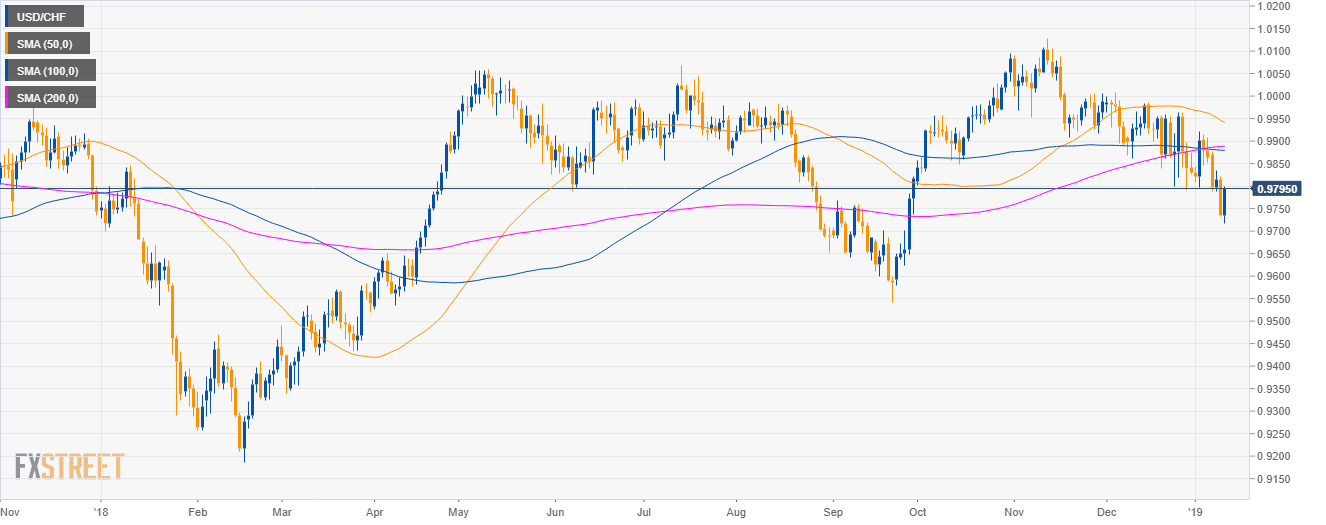
USD/CHF Daily chart
- USD/CHF is trading in a sideways trend below the 50, 100 and 200-period simple moving average (SMA).
- Fed’s Powell is speaking at 17.00 GMT and it can have a strong impact on the currency markets.
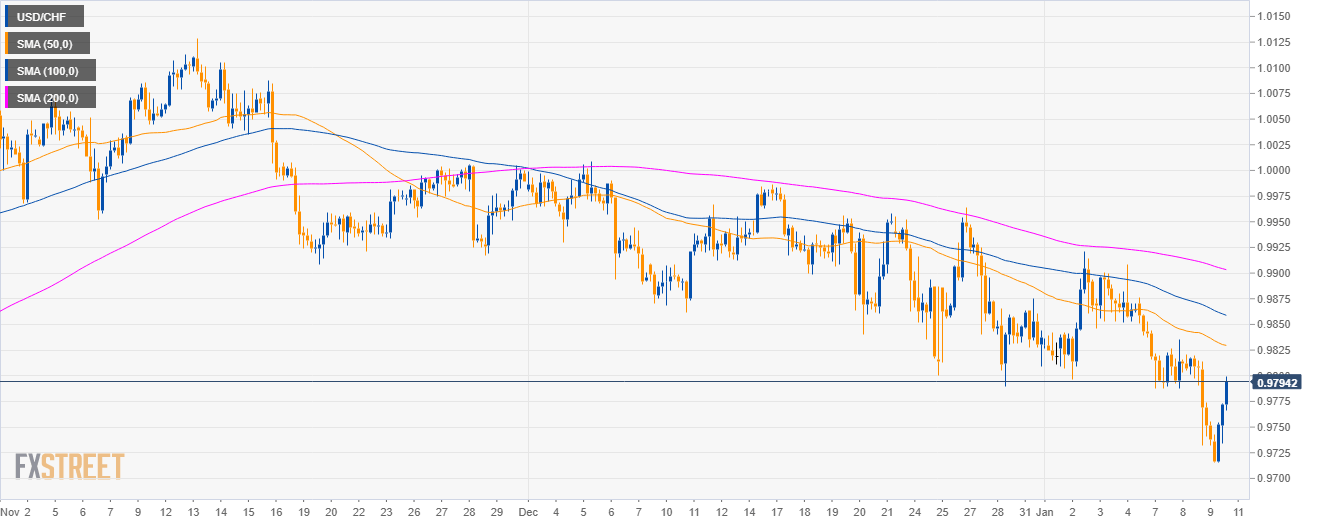
USD/CHF 4-hour chart
- USD/CHF is having a reversal up as it is trading below its main SMAs.
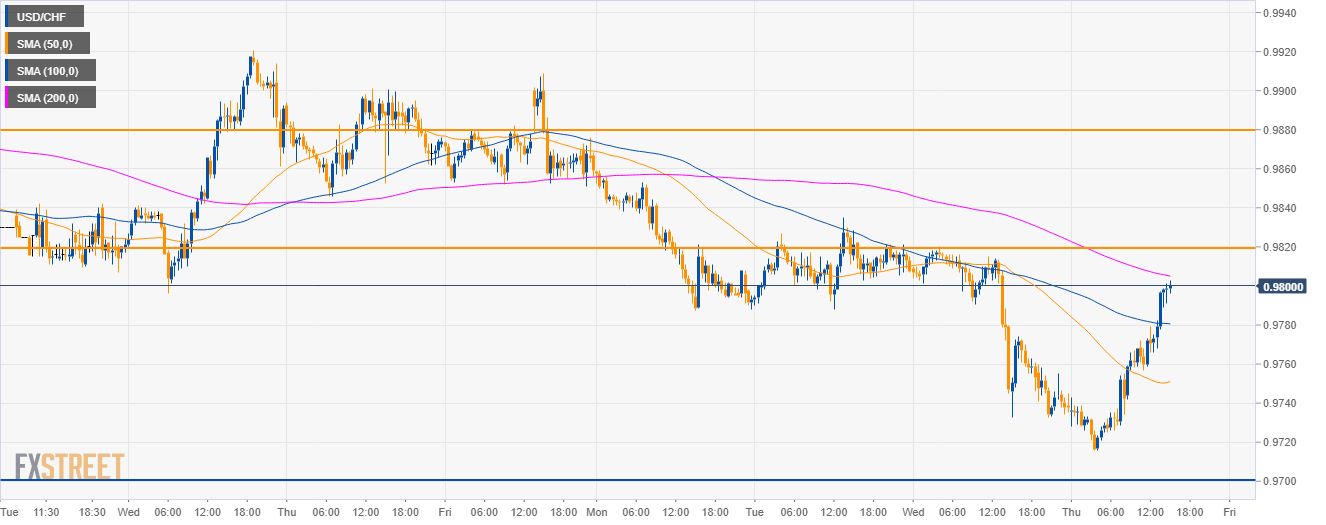
USD/CHF 30-minute chart
- USD bulls are gaining ground as they reclaimed the 50 and 100 SMA.
- The next hurdle to overcome is 0.9820 which would open the doors to 0.9880 target.
- To the downside 0.9700 is seen as support.
Additional key levels
USD/CHF
Overview:
Today Last Price: 0.9794
Today Daily change: 60 pips
Today Daily change %: 0.616%
Today Daily Open: 0.9734
Trends:
Previous Daily SMA20: 0.988
Previous Daily SMA50: 0.9946
Previous Daily SMA100: 0.988
Previous Daily SMA200: 0.9886
Levels:
Previous Daily High: 0.9821
Previous Daily Low: 0.9732
Previous Weekly High: 0.9921
Previous Weekly Low: 0.9796
Previous Monthly High: 1.0009
Previous Monthly Low: 0.979
Previous Daily Fibonacci 38.2%: 0.9766
Previous Daily Fibonacci 61.8%: 0.9787
Previous Daily Pivot Point S1: 0.9704
Previous Daily Pivot Point S2: 0.9674
Previous Daily Pivot Point S3: 0.9616
Previous Daily Pivot Point R1: 0.9793
Previous Daily Pivot Point R2: 0.9851
Previous Daily Pivot Point R3: 0.9881
