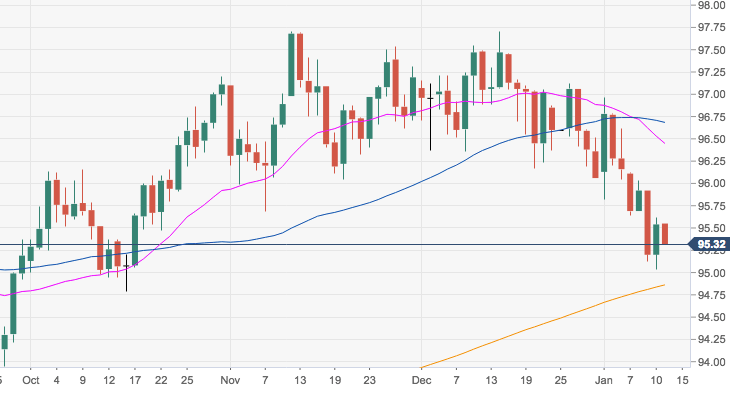
- The greenback remains under pressure after breaking below the multi-month sideline theme between 95.80 and 97.70 earlier in the week.
- The probability of further downside thus remains in place, with the immediate target at the 94.80 region, where converge the critical 200-day SMA and October lows.
- In case the selling impetus picks up extra pace, the 38.2% Fibo retracement of the 2017-2018 drop at 94.20 should come next ahead of September lows in the 93.70 zone.
DXY daily chart
Dollar Index Spot
Overview:
Today Last Price: 95.33
Today Daily change: -21 pips
Today Daily change %: -0.220%
Today Daily Open: 95.54
Trends:
Previous Daily SMA20: 96.5
Previous Daily SMA50: 96.7
Previous Daily SMA100: 96
Previous Daily SMA200: 94.84
Levels:
Previous Daily High: 95.62
Previous Daily Low: 95.03
Previous Weekly High: 96.96
Previous Weekly Low: 95.82
Previous Monthly High: 97.71
Previous Monthly Low: 96.06
Previous Daily Fibonacci 38.2%: 95.39
Previous Daily Fibonacci 61.8%: 95.26
Previous Daily Pivot Point S1: 95.17
Previous Daily Pivot Point S2: 94.81
Previous Daily Pivot Point S3: 94.58
Previous Daily Pivot Point R1: 95.76
Previous Daily Pivot Point R2: 95.99
Previous Daily Pivot Point R3: 96.35
