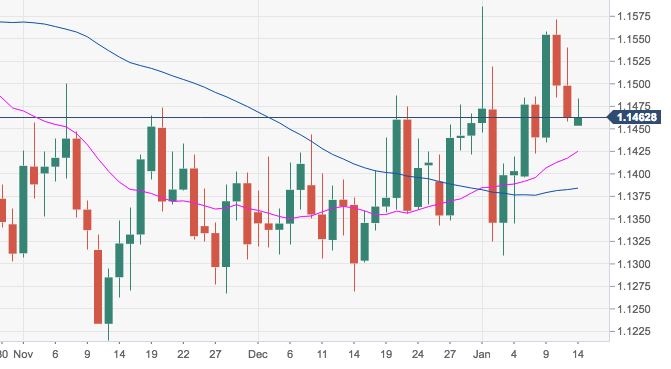
- The pair is alternating gains with losses at the beginning of the week, which continues to navigate around the 1.1470/80 band, where aligns the 100-day SMA.
- The recent up move has been capped by the proximity of 1.1580, where sits the 61.8% Fibo of the September-November drop. That said, spot should surpass this area on a convincing fashion in order to open the door for a test of 1.1600 and above.
- Extra consolidation could derive in a potential move lower with initial support at the 21-day SMA at 1.1411 ahead of the 55-day SMA at 1.1379.
EUR/USD daiy chart
EUR/USD
Overview:
Today Last Price: 1.1462
Today Daily change: -1.0 pips
Today Daily change %: -0.00872%
Today Daily Open: 1.1463
Trends:
Previous Daily SMA20: 1.1423
Previous Daily SMA50: 1.1384
Previous Daily SMA100: 1.1476
Previous Daily SMA200: 1.1627
Levels:
Previous Daily High: 1.1541
Previous Daily Low: 1.1458
Previous Weekly High: 1.1571
Previous Weekly Low: 1.1396
Previous Monthly High: 1.1486
Previous Monthly Low: 1.1269
Previous Daily Fibonacci 38.2%: 1.1489
Previous Daily Fibonacci 61.8%: 1.1509
Previous Daily Pivot Point S1: 1.1434
Previous Daily Pivot Point S2: 1.1404
Previous Daily Pivot Point S3: 1.1351
Previous Daily Pivot Point R1: 1.1516
Previous Daily Pivot Point R2: 1.157
Previous Daily Pivot Point R3: 1.1599
