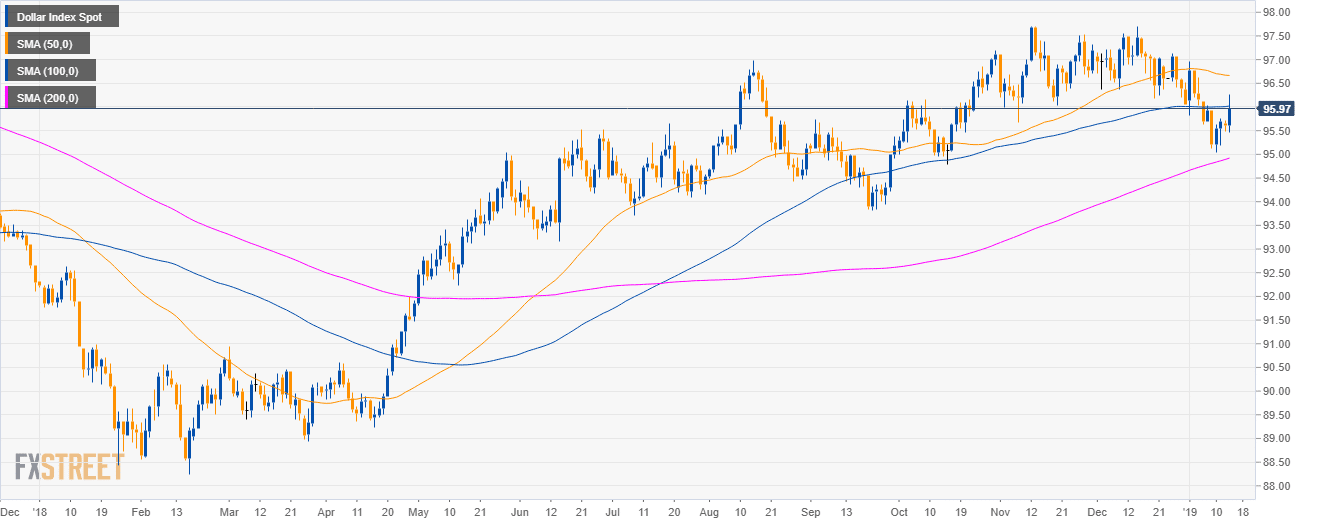
DXY daily chart
- The US Dollar Index (DXY) is trading in a bull trend above the 200-period simple moving average (SMA).
- The market is testing the 100 SMA.
- As forecast on January 9, DXY hit the 96.00 target.
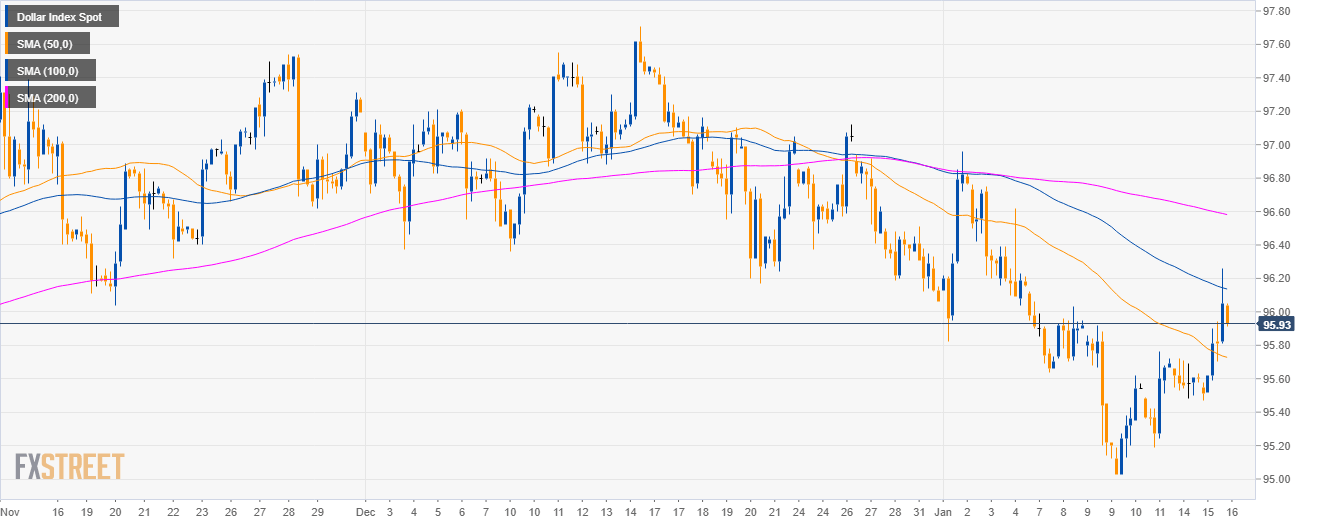
DXY 4-hour chart
- DXY bulls reclaimed the 50 SMA but found some resistance at the 96.00 figure.
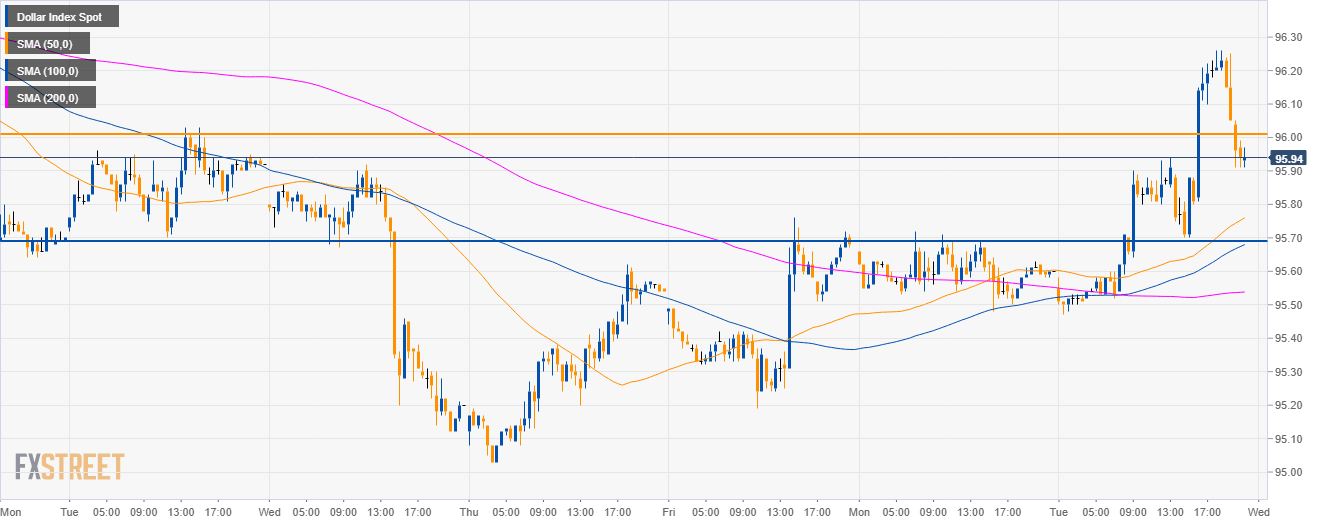
DXY 30-minute chart
- In the short-term traders can expect a drop to 95.70.
Additional key levels
Dollar Index Spot
Overview:
Today Last Price: 95.94
Today Daily change: 34 pips
Today Daily change %: 0.356%
Today Daily Open: 95.6
Trends:
Previous Daily SMA20: 96.34
Previous Daily SMA50: 96.67
Previous Daily SMA100: 96.01
Previous Daily SMA200: 94.89
Levels:
Previous Daily High: 95.72
Previous Daily Low: 95.48
Previous Weekly High: 96.12
Previous Weekly Low: 95.03
Previous Monthly High: 97.71
Previous Monthly Low: 96.06
Previous Daily Fibonacci 38.2%: 95.57
Previous Daily Fibonacci 61.8%: 95.63
Previous Daily Pivot Point S1: 95.48
Previous Daily Pivot Point S2: 95.36
Previous Daily Pivot Point S3: 95.24
Previous Daily Pivot Point R1: 95.72
Previous Daily Pivot Point R2: 95.84
Previous Daily Pivot Point R3: 95.96
