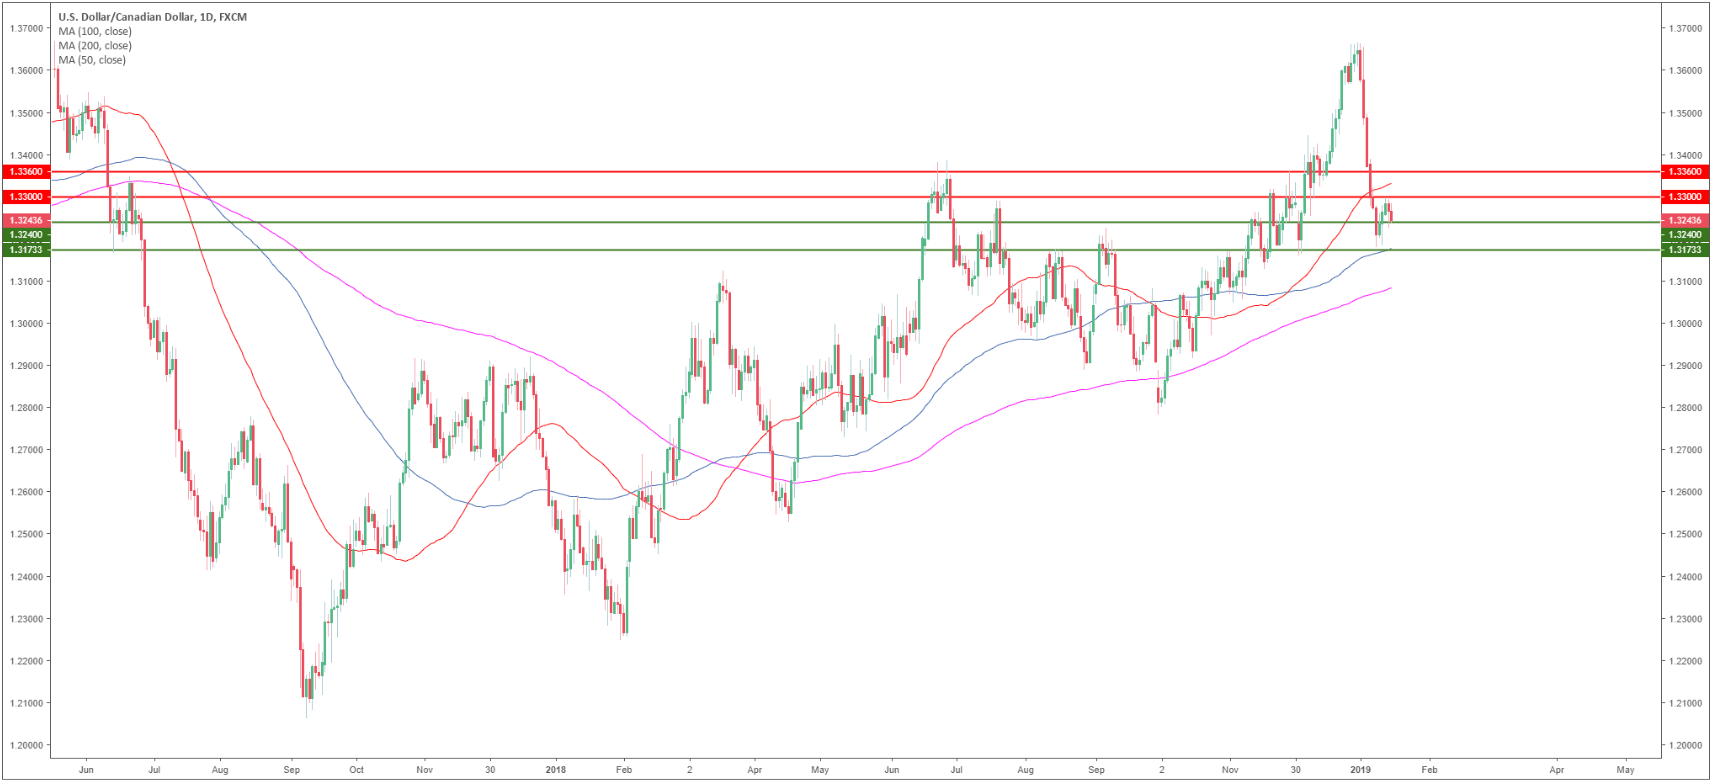
USD/CAD Daily chart
- USD/CAD is trading in a bull trend above the 200-period simple moving average (SMA).
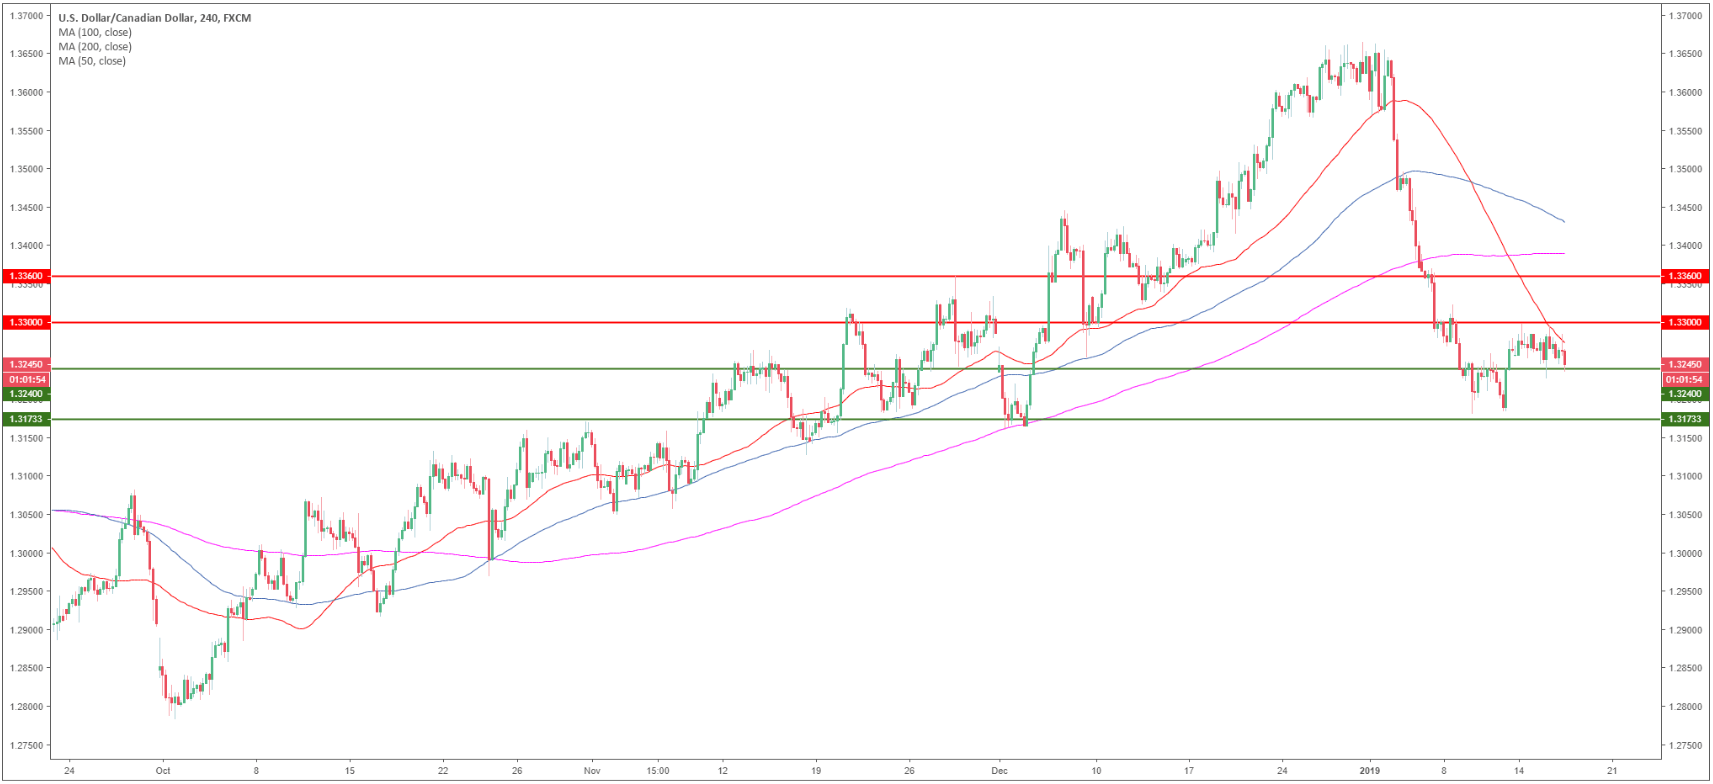
USD/CAD 4-hour chart
- USD/CAD is rejecting the 50 SMA.
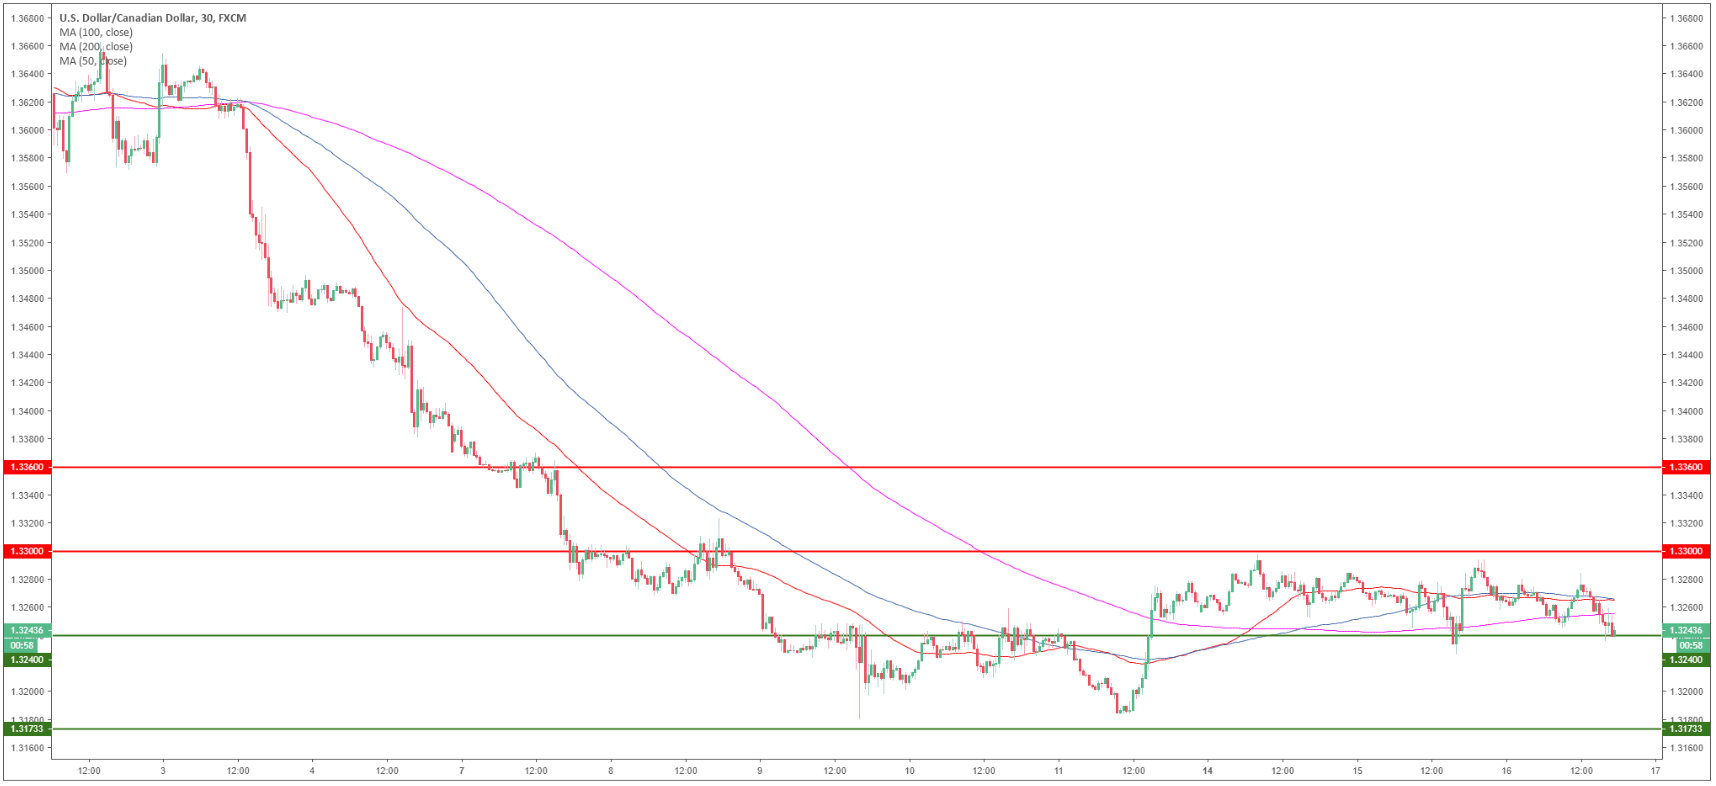
USD/CAD 30-minute chart
- Bears are trading below the main SMAs and need to break below the 1.3240 support in order to reach the 1.3180 level.
- On the flip side, resistance is seen at the 1.3300 figure.
Additional key levels
USD/CAD
Overview:
Today Last Price: 1.3244
Today Daily change: -25 pips
Today Daily change %: -0.188%
Today Daily Open: 1.3269
Trends:
Previous Daily SMA20: 1.3486
Previous Daily SMA50: 1.3362
Previous Daily SMA100: 1.3193
Previous Daily SMA200: 1.3091
Levels:
Previous Daily High: 1.3296
Previous Daily Low: 1.3226
Previous Weekly High: 1.339
Previous Weekly Low: 1.318
Previous Monthly High: 1.4134
Previous Monthly Low: 1.316
Previous Daily Fibonacci 38.2%: 1.3253
Previous Daily Fibonacci 61.8%: 1.3269
Previous Daily Pivot Point S1: 1.3232
Previous Daily Pivot Point S2: 1.3195
Previous Daily Pivot Point S3: 1.3163
Previous Daily Pivot Point R1: 1.3301
Previous Daily Pivot Point R2: 1.3333
Previous Daily Pivot Point R3: 1.337
