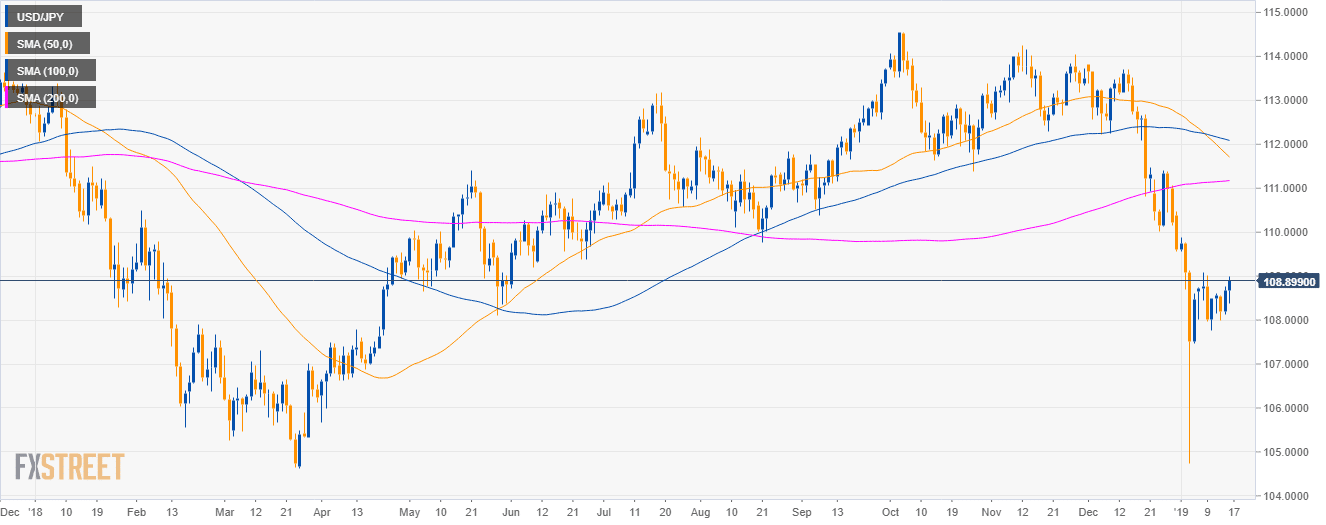
USD/JPY daily chart
- USD/JPY is trading in a deep pullback below the 50, 100 and 200-period simple moving averages (SMAs).
- As discussed, 109.00 the figure was indeed on the cards for bulls.
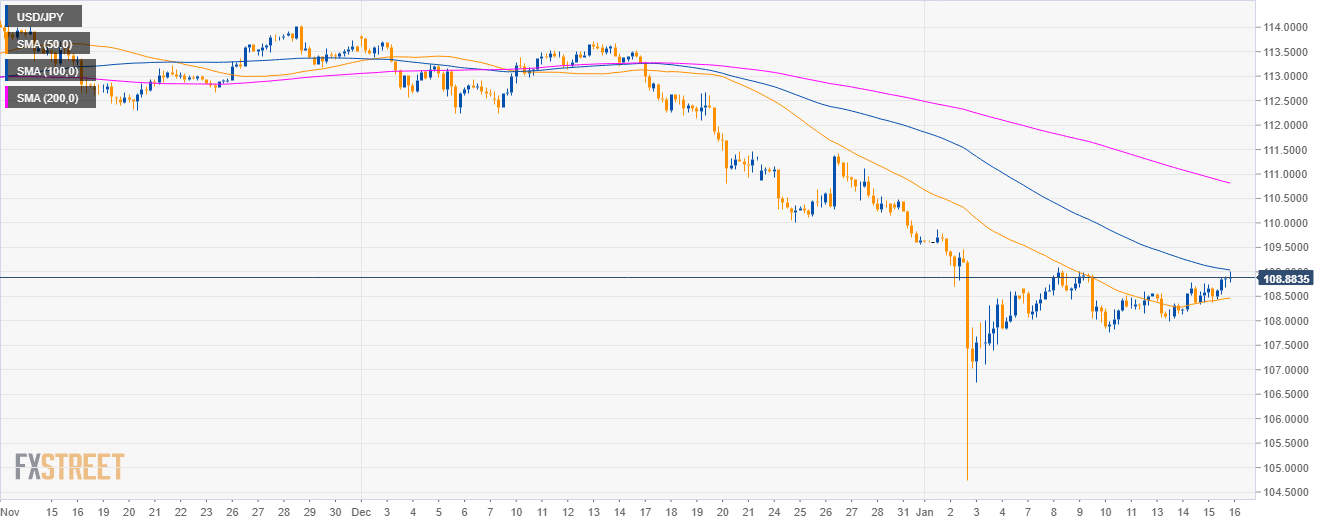
USD/JPY 4-hour chart
- Bulls are challenging the 109.00 figure along with the 109.00 figure.
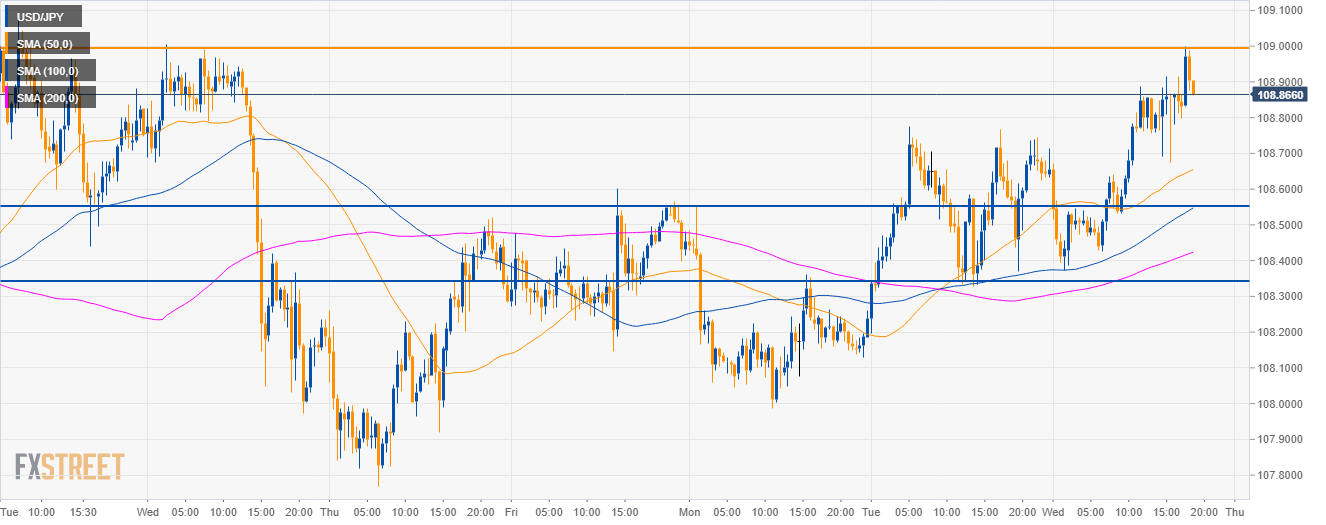
USD/JPY 30-minute chart
- The market is set to decline to the 108.55 level and down to 108.30 if the bears gather enough steam.
Additional key levels
USD/JPY
Overview:
Today Last Price: 108.87
Today Daily change: 20 pips
Today Daily change %: 0.184%
Today Daily Open: 108.67
Trends:
Previous Daily SMA20: 109.6
Previous Daily SMA50: 111.8
Previous Daily SMA100: 112.12
Previous Daily SMA200: 111.16
Levels:
Previous Daily High: 108.78
Previous Daily Low: 108.13
Previous Weekly High: 109.09
Previous Weekly Low: 107.77
Previous Monthly High: 113.83
Previous Monthly Low: 109.55
Previous Daily Fibonacci 38.2%: 108.53
Previous Daily Fibonacci 61.8%: 108.38
Previous Daily Pivot Point S1: 108.27
Previous Daily Pivot Point S2: 107.88
Previous Daily Pivot Point S3: 107.63
Previous Daily Pivot Point R1: 108.92
Previous Daily Pivot Point R2: 109.17
Previous Daily Pivot Point R3: 109.57
