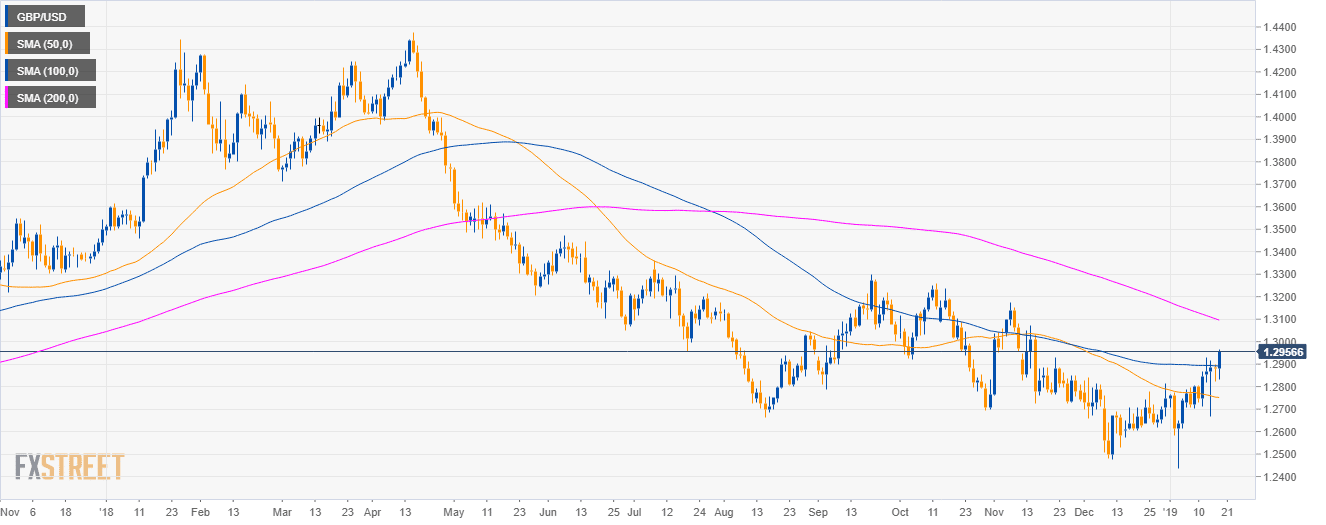
GBP/USD daily chart
- GBP/USD is trading in a bear trend below the 200-day simple moving averages (SMAs) however bulls are back as they are attempting to break the 1.2950 level.
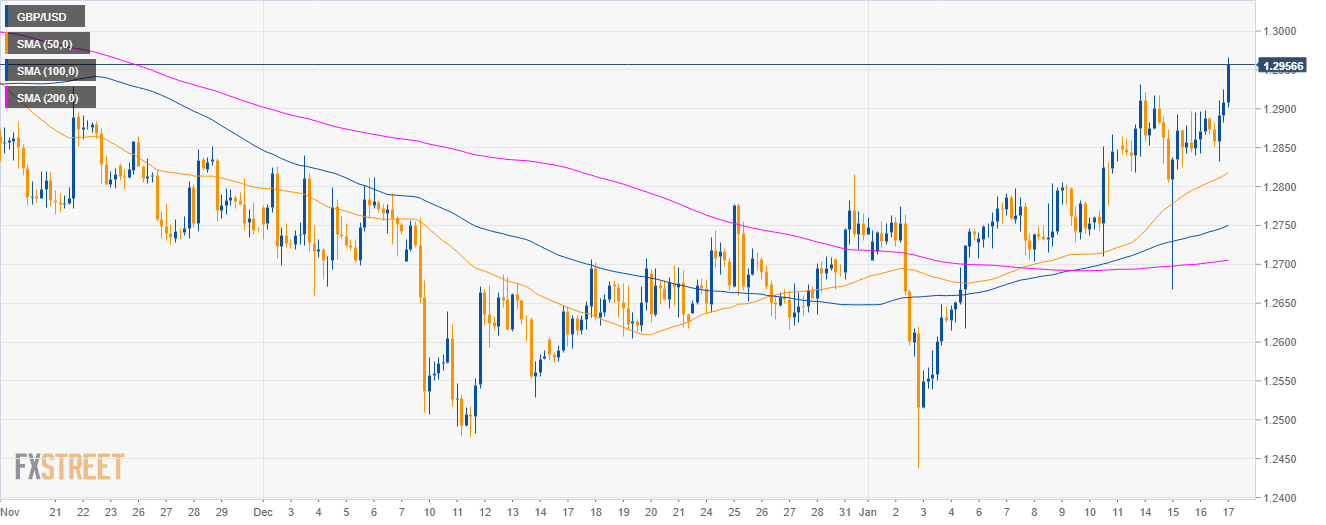
GBP/USD 4-hour chart
- GBP/USD is trading above its main SMAs as bulls broke above the 1.2900 figure.
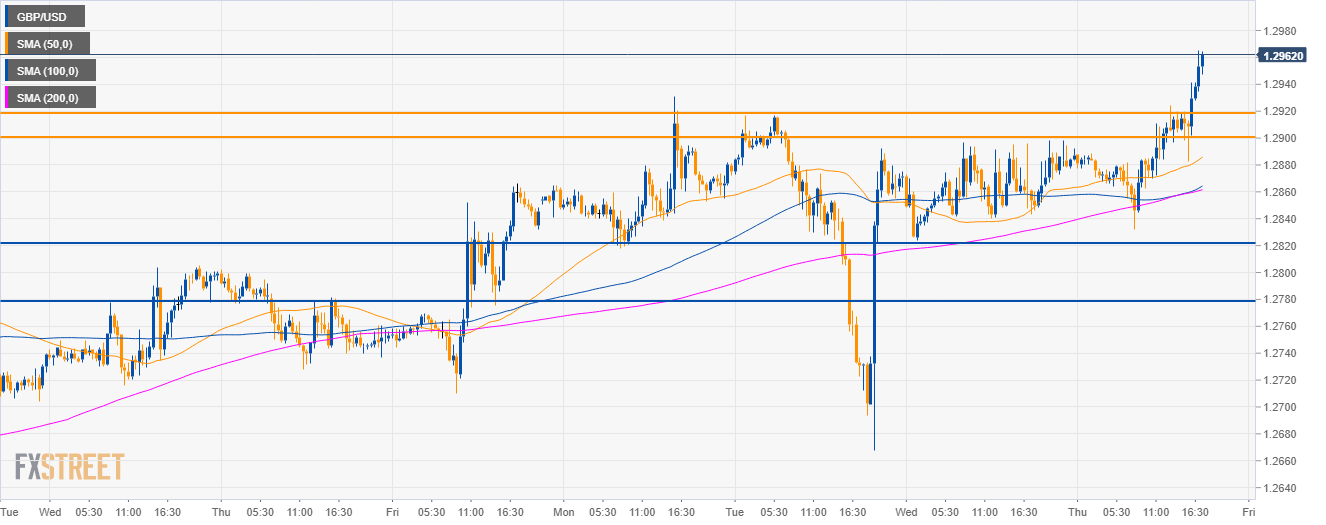
GBP/USD 30-minute chart
- GBP/USD is trading above the main SMAs as the momentum is to the upside.
- The next resistances to the upside are seen at the 1.2780 and 1.3060 levels.
Additional key levels
GBP/USD
Overview:
Today Last Price: 1.2962
Today Daily change: 81 pips
Today Daily change %: 0.629%
Today Daily Open: 1.2881
Trends:
Daily SMA20: 1.2734
Daily SMA50: 1.2753
Daily SMA100: 1.2892
Daily SMA200: 1.3105
Levels:
Previous Daily High: 1.2898
Previous Daily Low: 1.2824
Previous Weekly High: 1.2866
Previous Weekly Low: 1.2704
Previous Monthly High: 1.284
Previous Monthly Low: 1.2477
Daily Fibonacci 38.2%: 1.2852
Daily Fibonacci 61.8%: 1.287
Daily Pivot Point S1: 1.2837
Daily Pivot Point S2: 1.2794
Daily Pivot Point S3: 1.2763
Daily Pivot Point R1: 1.2911
Daily Pivot Point R2: 1.2942
Daily Pivot Point R3: 1.2985
