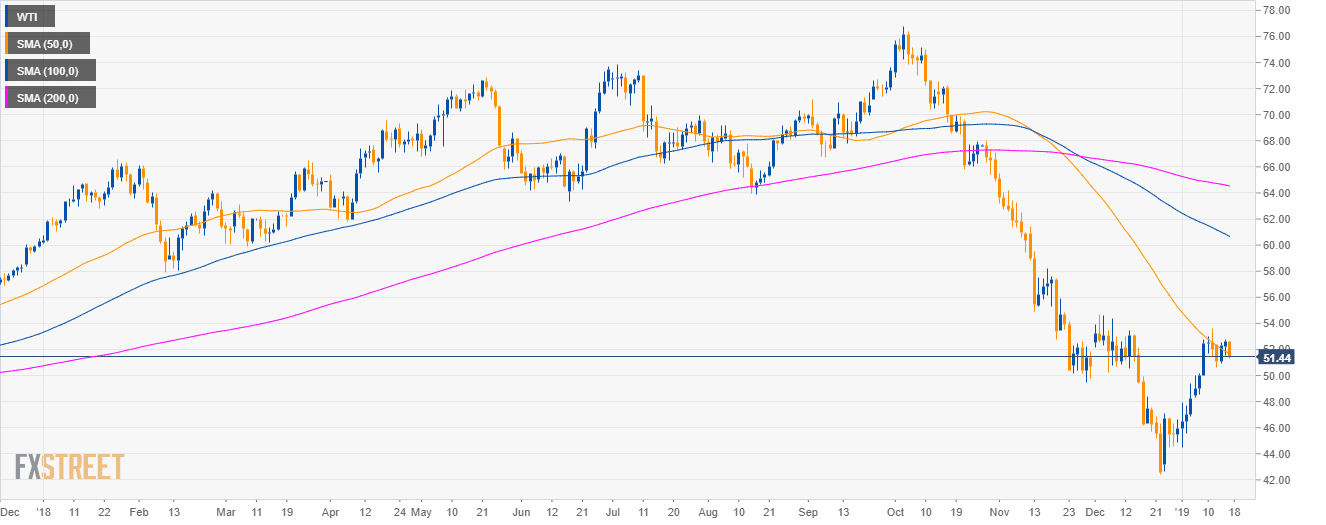
Oil daily chart
- Crude oil WTI is trading in a bear trend below the 50, 100 and 200-day simple moving averages (SMAs).
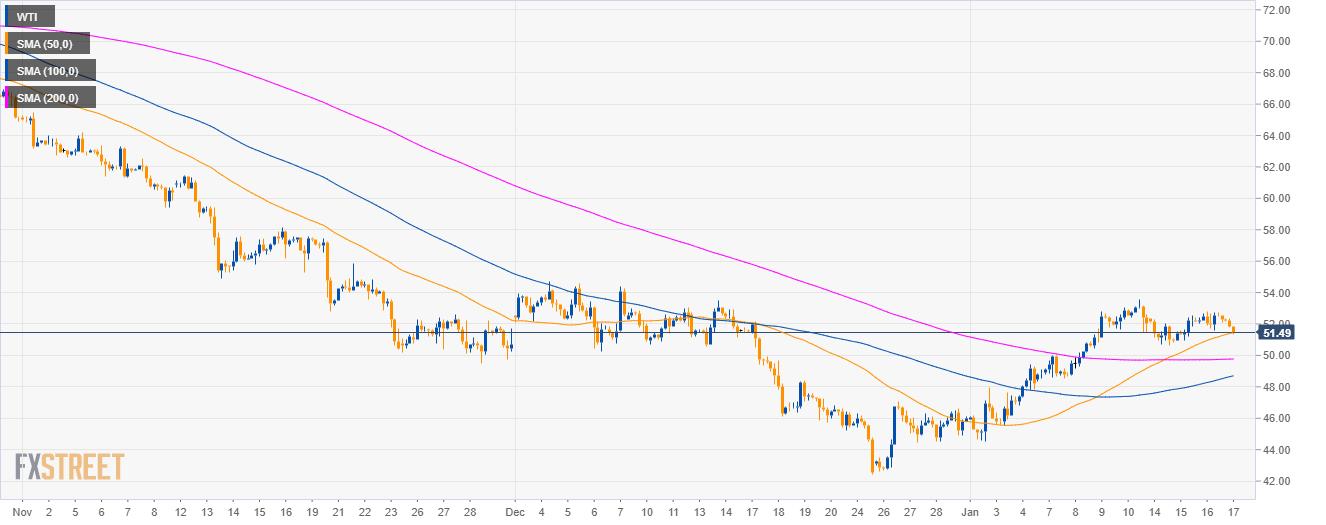
Oil 4-hour chart
- WTI is testing the 50 SMA as bears are driving the price below $52.00 a barrel.
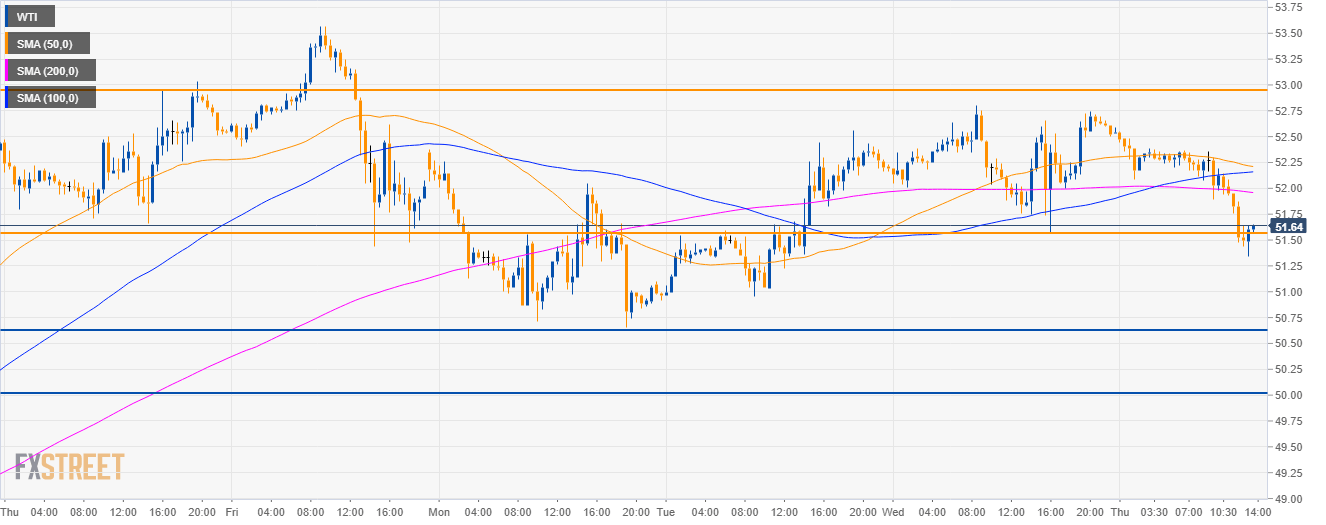
Oil 30-minute chart
- Bears are breaking below 51.55 support as the market is trading below its mains SMAs.
- A sustained move beyond that level would open the doors to 50.60 level and 50.00 the figure.
Additional key levels
EUR/USD
Overview:
Today Last Price: 1.1399
Today Daily change: 5 pips
Today Daily change %: 0.0527%
Today Daily Open: 1.1393
Trends:
Daily SMA20: 1.1433
Daily SMA50: 1.1384
Daily SMA100: 1.1468
Daily SMA200: 1.1614
Levels:
Previous Daily High: 1.1425
Previous Daily Low: 1.1378
Previous Weekly High: 1.1571
Previous Weekly Low: 1.1396
Previous Monthly High: 1.1486
Previous Monthly Low: 1.1269
Daily Fibonacci 38.2%: 1.1396
Daily Fibonacci 61.8%: 1.1407
Daily Pivot Point S1: 1.1372
Daily Pivot Point S2: 1.1351
Daily Pivot Point S3: 1.1324
Daily Pivot Point R1: 1.1419
Daily Pivot Point R2: 1.1446
Daily Pivot Point R3: 1.1467
