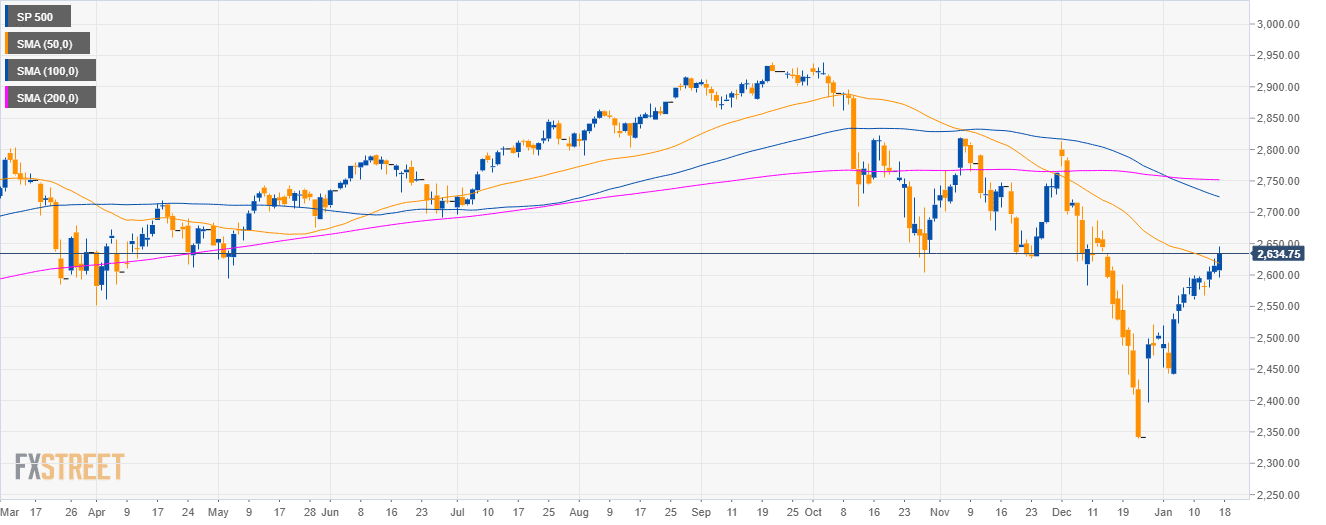
S&P500 daily chart
- The S&P500 is in a deep pullback below the 100 and 200-day simple moving averages (SMAs).
- The SP500 spiked about 24 points up as the Wall Street Journal reported that the US considers lifting China tariffs. However, the US Treasury soon denied the report’s claims.
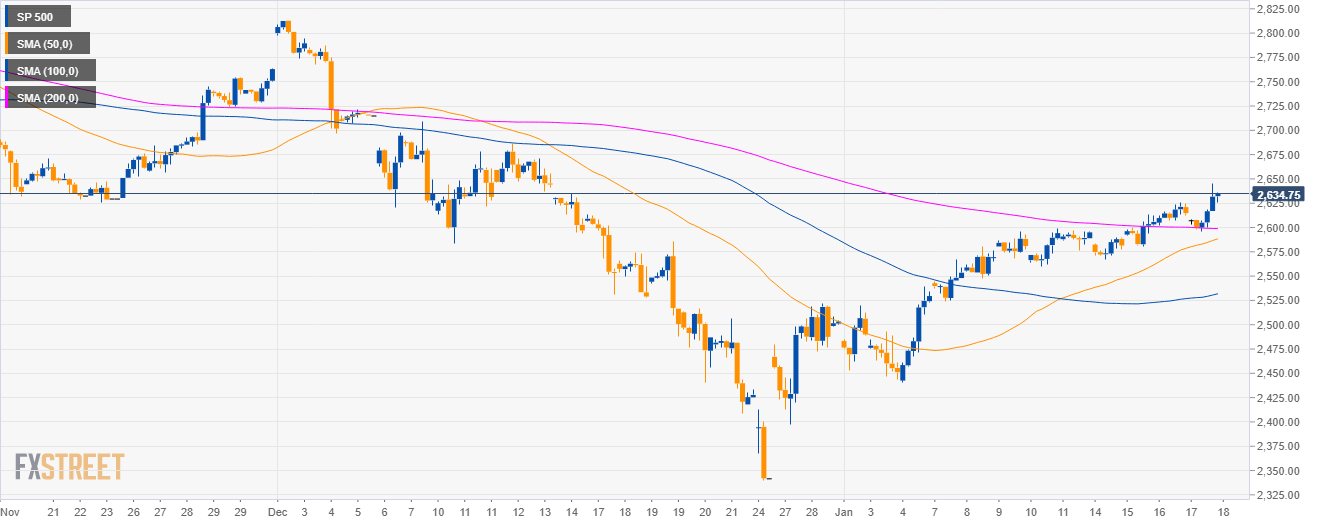
S&P500 4-hour chart
- Bulls have reclaimed the main SMAs as well as the 2,600.00 figure.
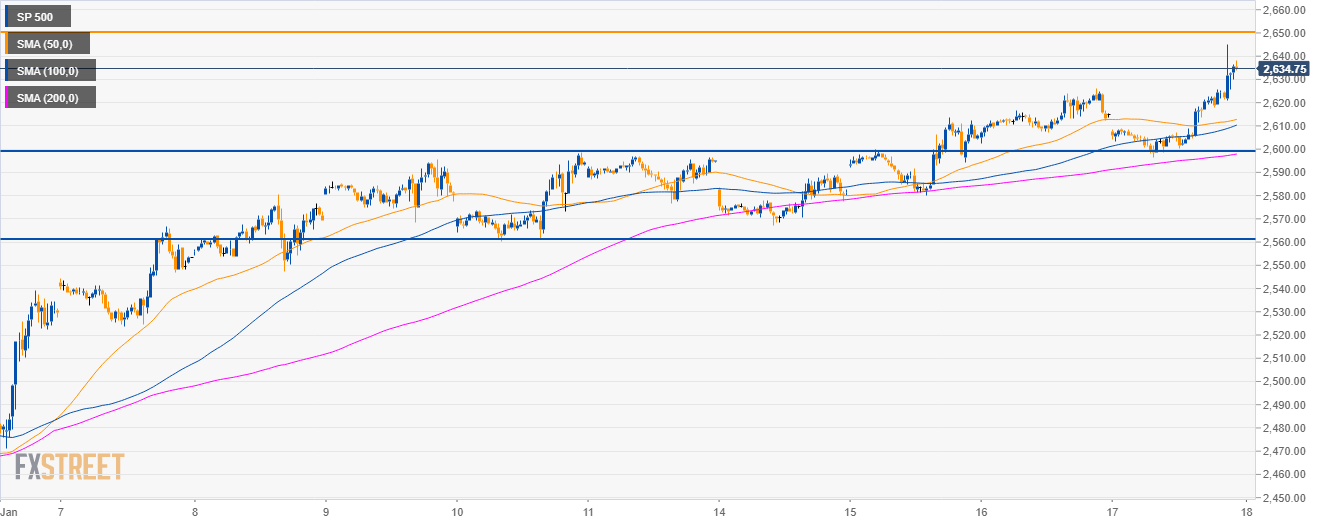
S&P500 30-minute chart
- As bulls gather momentum, a break of the 2,650.00 level would open the doors to the 2,700.00 figure.
- Support is seen at the 2,600.00 figure.
Additional key levels
SP 500
Overview:
Today Last Price: 2635.75
Today Daily change: 2100 pips
Today Daily change %: 0.803%
Today Daily Open: 2614.75
Trends:
Daily SMA20: 2513.39
Daily SMA50: 2621.99
Daily SMA100: 2727.13
Daily SMA200: 2751.98
Levels:
Previous Daily High: 2626
Previous Daily Low: 2602.5
Previous Weekly High: 2598.75
Previous Weekly Low: 2523.5
Previous Monthly High: 2813.5
Previous Monthly Low: 2340.25
Daily Fibonacci 38.2%: 2617.02
Daily Fibonacci 61.8%: 2611.48
Daily Pivot Point S1: 2602.83
Daily Pivot Point S2: 2590.92
Daily Pivot Point S3: 2579.33
Daily Pivot Point R1: 2626.33
Daily Pivot Point R2: 2637.92
Daily Pivot Point R3: 2649.83
