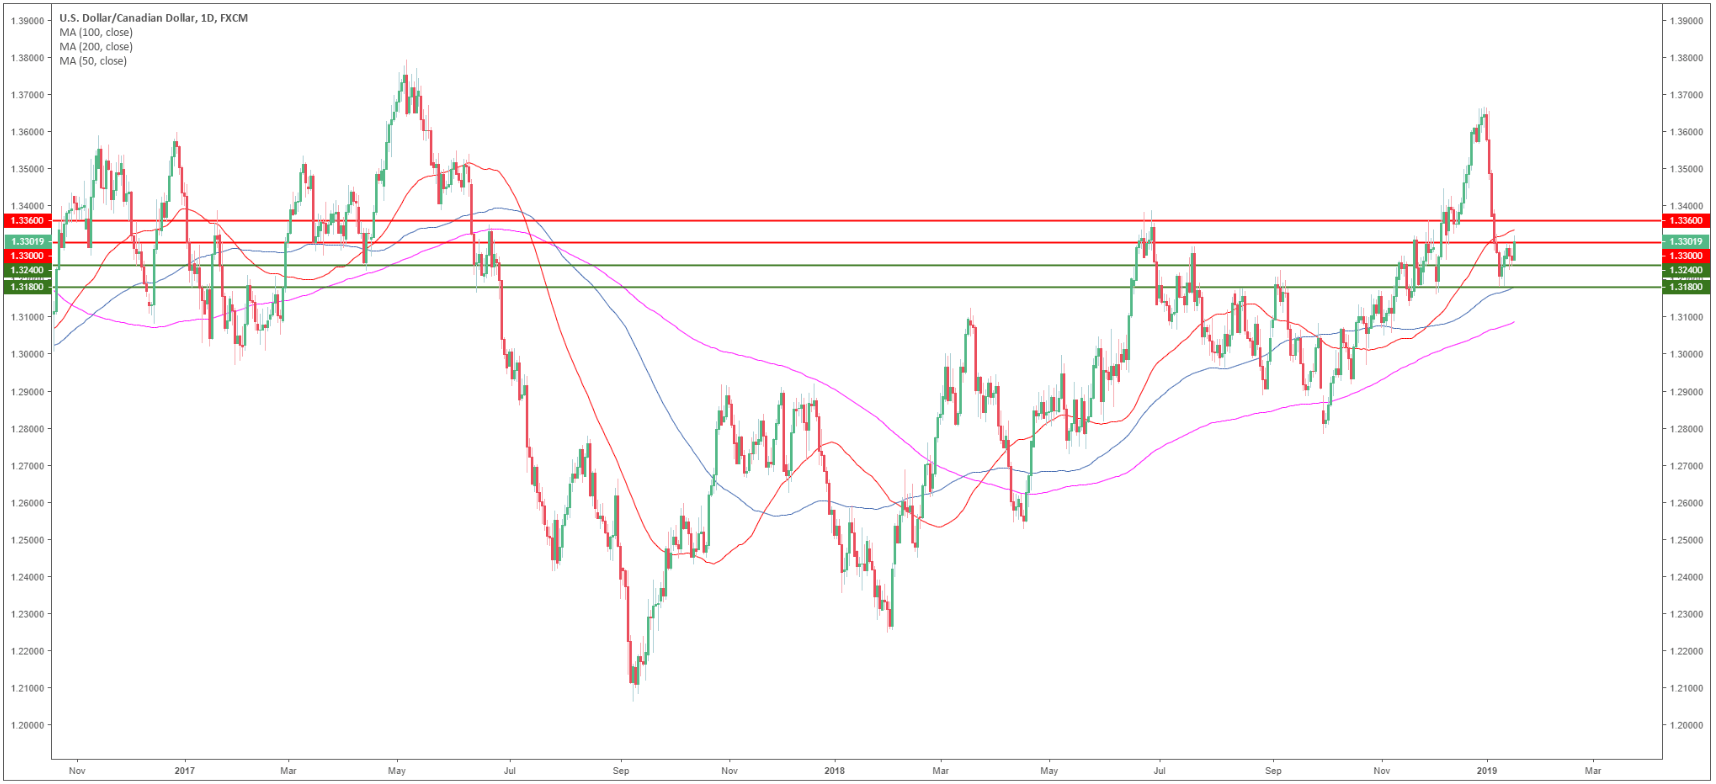
USD/CAD daily chart
- USD/CAD is trading in a bull trend above the 100 and 200-day simple moving averages (SMAs).
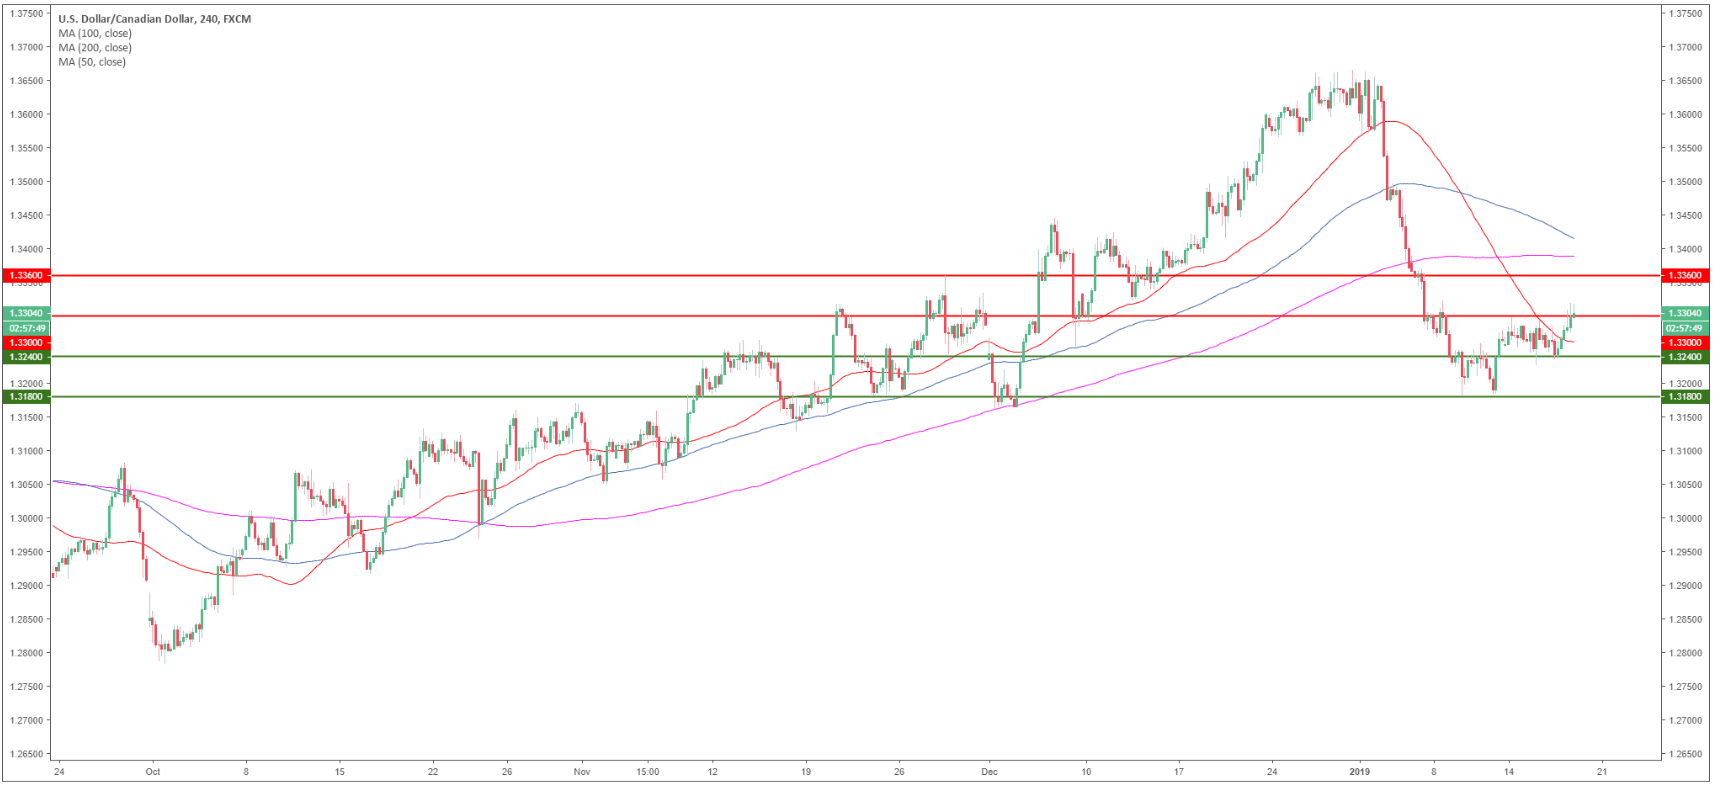
USD/CAD 4-hour chart
- USD/CAD is trading above the 50 SMA as bulls are trying to retake the 1.3300 figure.
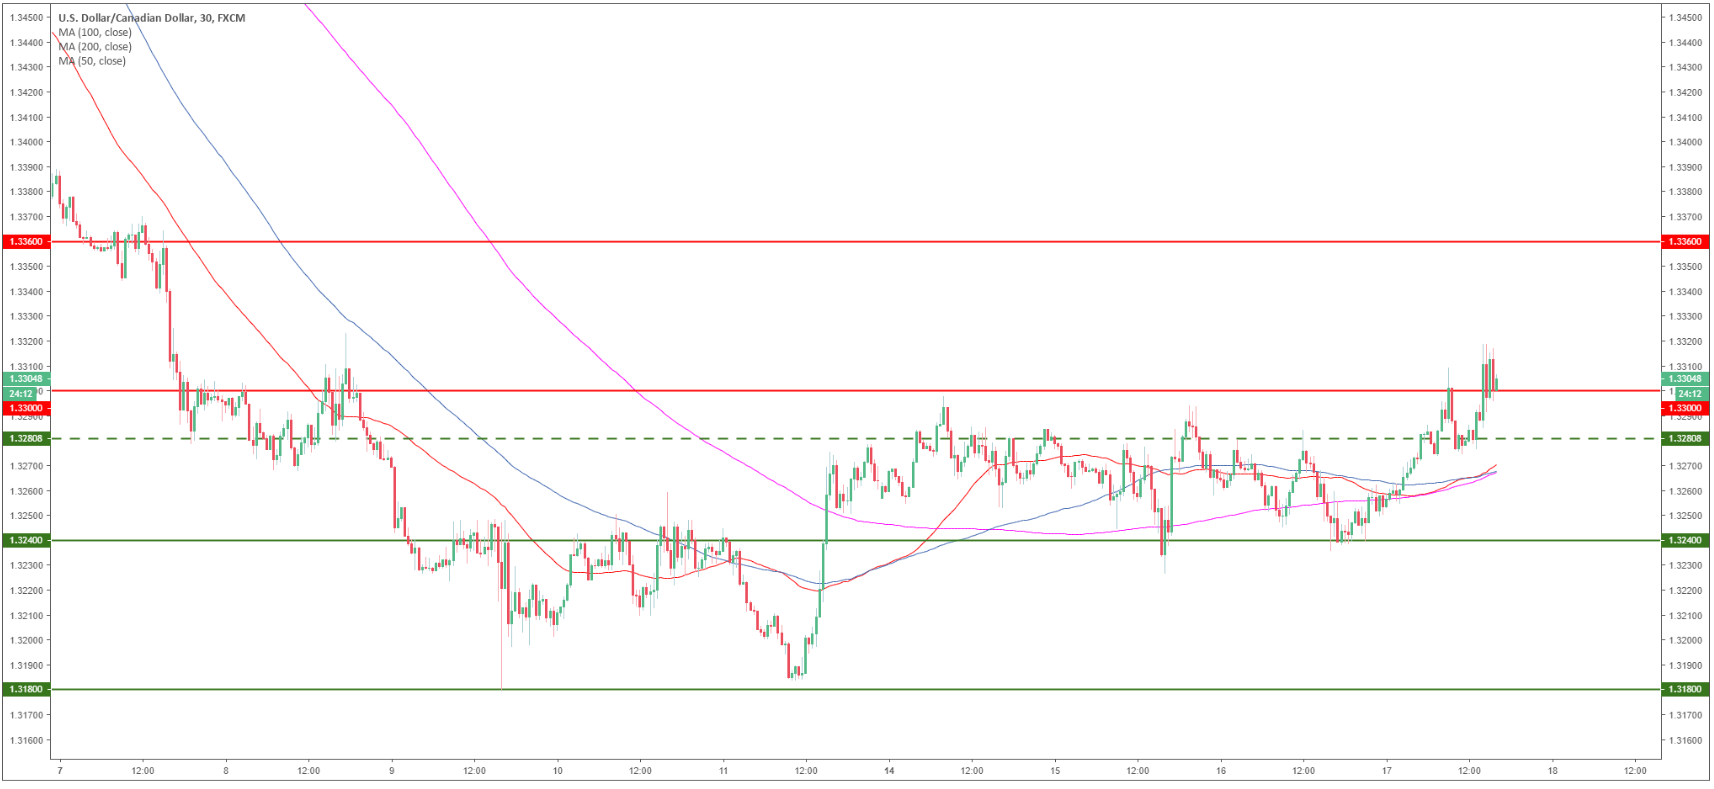
USD/CAD 30-minute chart
- USD bulls are trying to break above the 1.3300 figure.
- However, bears are likely to regain control and drive the market down to 1.3280 and down to 1.3240 if sellers gather enough steam.
Additional key levels
USD/CAD
Overview:
Today Last Price: 1.33
Today Daily change: 41 pips
Today Daily change %: 0.317%
Today Daily Open: 1.3258
Trends:
Daily SMA20: 1.3474
Daily SMA50: 1.3365
Daily SMA100: 1.3196
Daily SMA200: 1.3094
Levels:
Previous Daily High: 1.3285
Previous Daily Low: 1.3235
Previous Weekly High: 1.339
Previous Weekly Low: 1.318
Previous Monthly High: 1.4134
Previous Monthly Low: 1.316
Daily Fibonacci 38.2%: 1.3254
Daily Fibonacci 61.8%: 1.3266
Daily Pivot Point S1: 1.3233
Daily Pivot Point S2: 1.3209
Daily Pivot Point S3: 1.3183
Daily Pivot Point R1: 1.3284
Daily Pivot Point R2: 1.331
Daily Pivot Point R3: 1.3334
