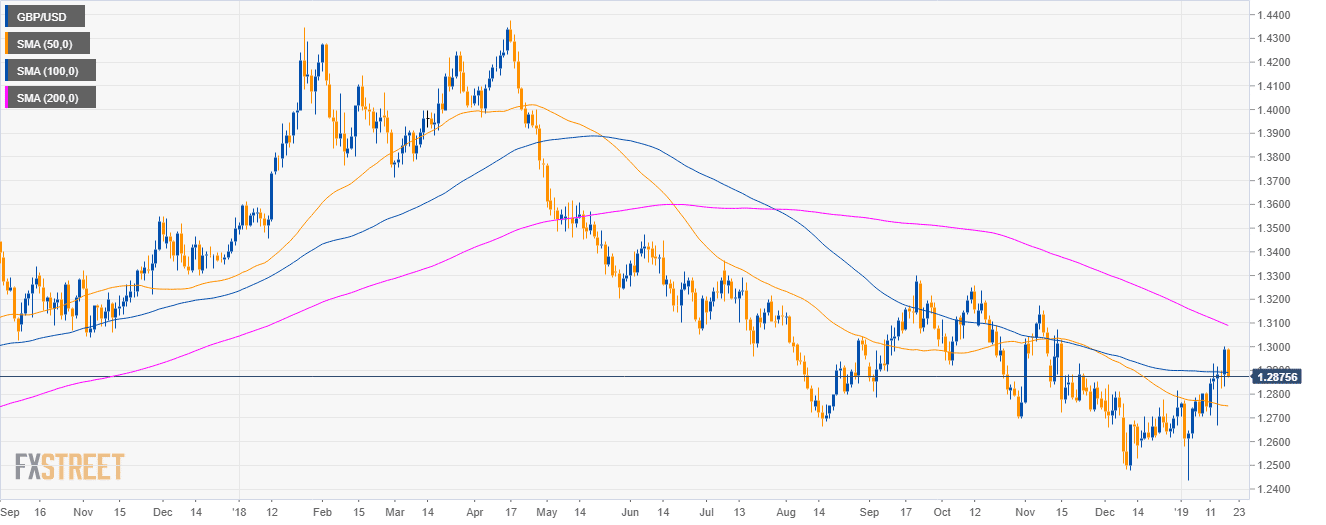
GBP/USD chart
- GBP/USD is in a bear trend below its 200-day simple moving averages (SMA).
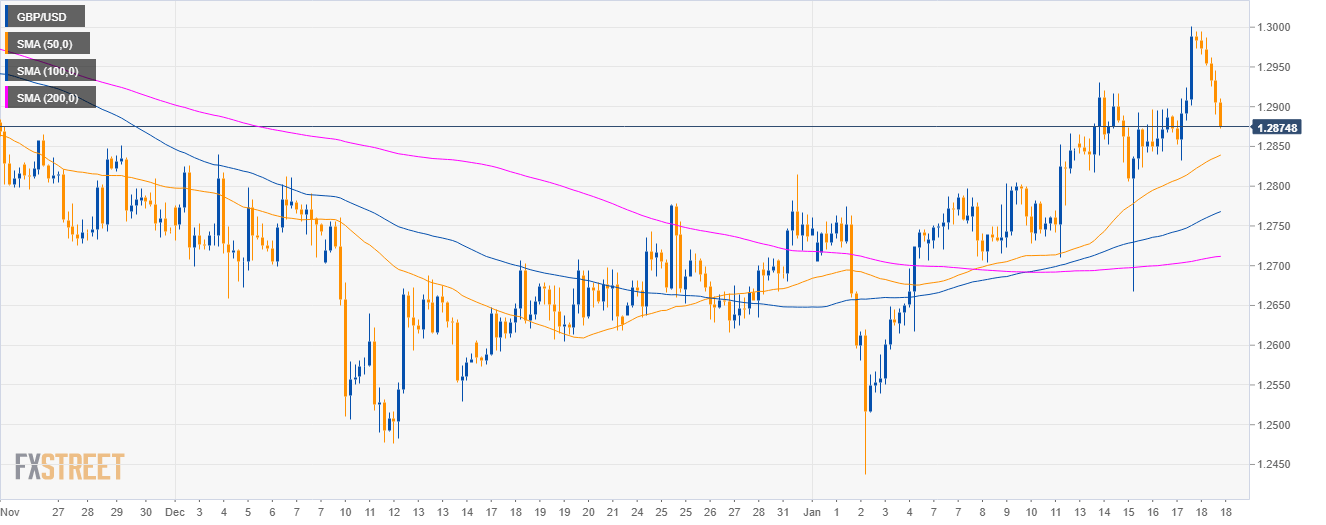
GBP/USD 4-hour chart
- GBP/USD is trading above its mains SMAs.
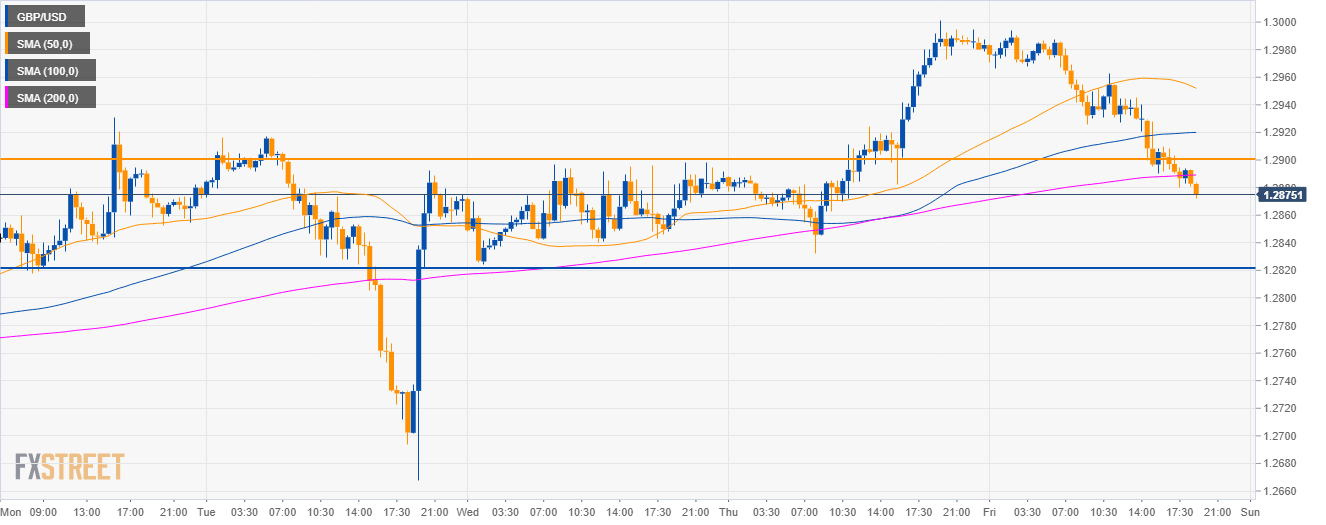
GBP/USD 30-minute chart
- As bears broke below the 1.2900 figure and the 200 SMA, GBP/USD is set to decline toward the 1.2820 level.
Additional key levels
GBP/USD
Overview:
Today Last Price: 1.2875
Today Daily change: -0.0113 pips
Today Daily change %: -0.87%
Today Daily Open: 1.2988
Trends:
Daily SMA20: 1.275
Daily SMA50: 1.2752
Daily SMA100: 1.2892
Daily SMA200: 1.3099
Levels:
Previous Daily High: 1.3002
Previous Daily Low: 1.2832
Previous Weekly High: 1.2866
Previous Weekly Low: 1.2704
Previous Monthly High: 1.284
Previous Monthly Low: 1.2477
Daily Fibonacci 38.2%: 1.2937
Daily Fibonacci 61.8%: 1.2897
Daily Pivot Point S1: 1.288
Daily Pivot Point S2: 1.2771
Daily Pivot Point S3: 1.271
Daily Pivot Point R1: 1.3049
Daily Pivot Point R2: 1.311
Daily Pivot Point R3: 1.3219
