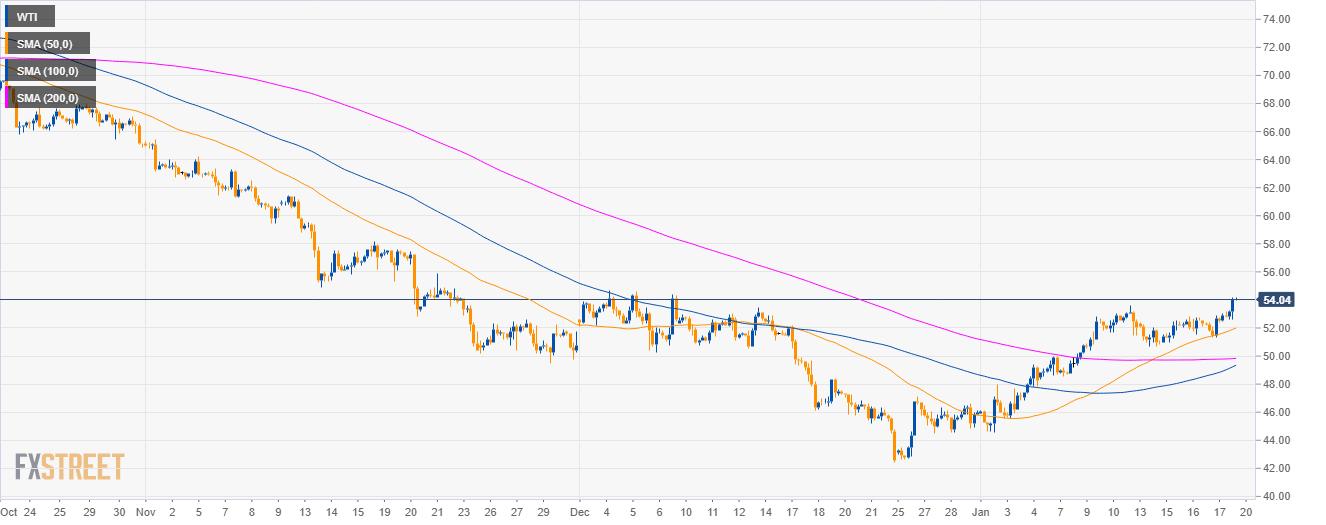
Oil daily chart
- Crude oil WTI is trading in a bear trend below the 100 and 200-day simple moving averages (SMAs).
- Bulls broke above 52.00 figure and the 50 SMA.

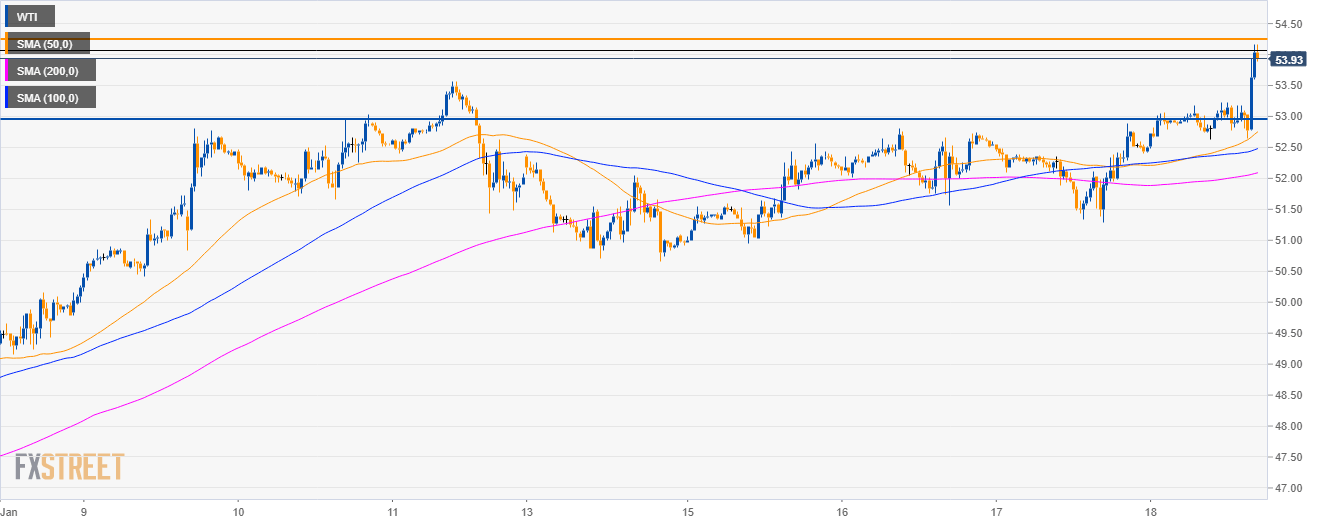
Oil 4-hour chart
- WTI is challenging the 54.00 figure as bulls are trading at the highest point since the start of 2019.
Oil 30-minute chart
- If bulls break above 54.40 a continuation up to 56.00 figure is likely on the cards.
- On the flip side, if bears keep the market below 54.40 then investors can expect a pullback down to 53.00 figure.
Additional key levels
WTI
Overview:
Today Last Price: 53.92
Today Daily change: 142 pips
Today Daily change %: 2.70%
Today Daily Open: 52.5
Trends:
Daily SMA20: 48.8
Daily SMA50: 50.96
Daily SMA100: 59.86
Daily SMA200: 64.2
Levels:
Previous Daily High: 52.89
Previous Daily Low: 51.29
Previous Weekly High: 53.57
Previous Weekly Low: 48.33
Previous Monthly High: 54.68
Previous Monthly Low: 42.45
Daily Fibonacci 38.2%: 51.9
Daily Fibonacci 61.8%: 52.28
Daily Pivot Point S1: 51.56
Daily Pivot Point S2: 50.63
Daily Pivot Point S3: 49.96
Daily Pivot Point R1: 53.16
Daily Pivot Point R2: 53.83
Daily Pivot Point R3: 54.76
