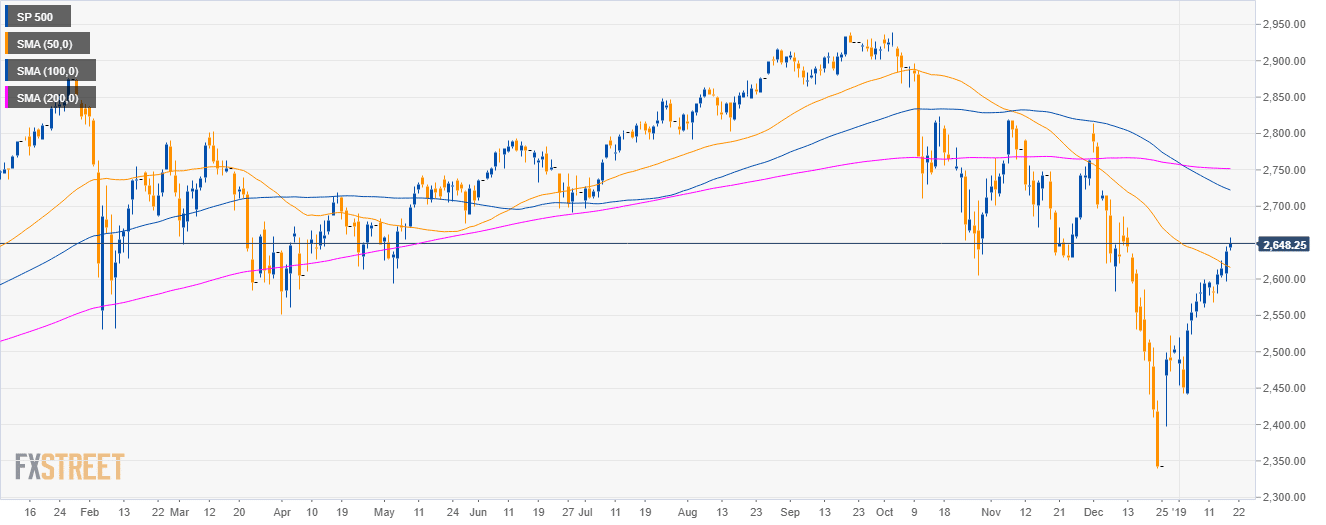
S&P500 daily chart
- The S&P500 is in a deep pullback below the 100 and 200-day simple moving averages (SMAs).
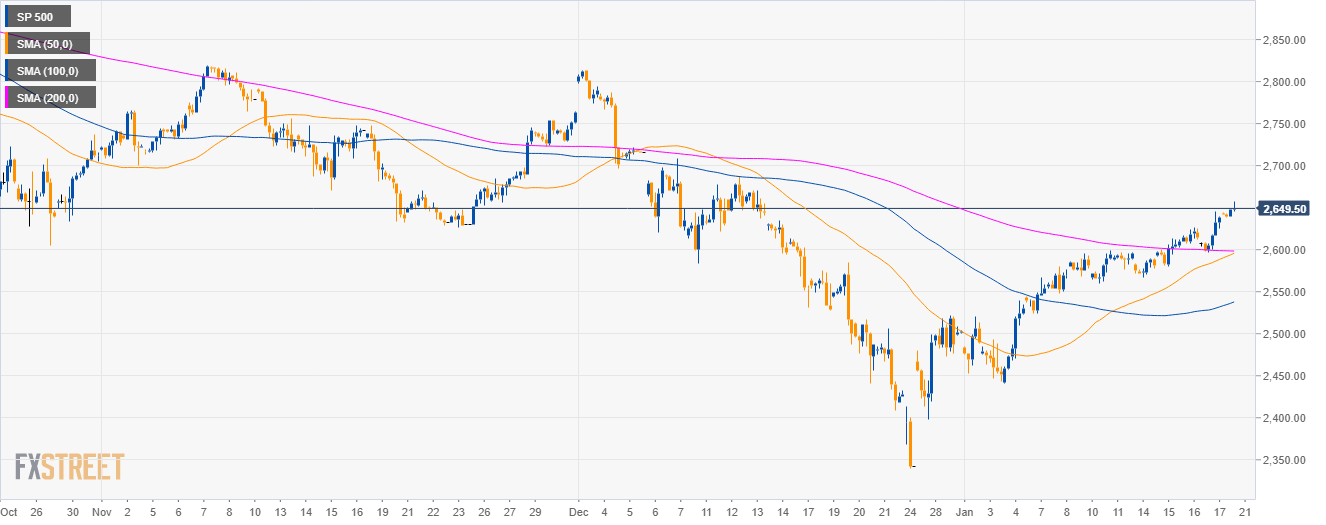
S&P500 4-hour chart
- The bulls broke above the main SMAs and the 2,600.00 figure.
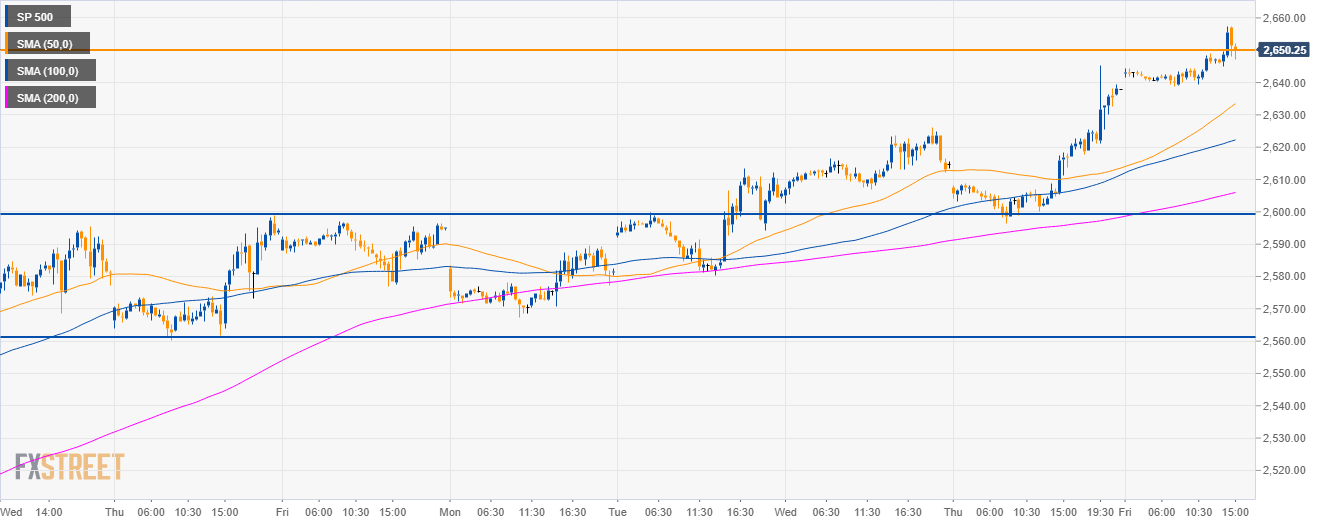
S&P500 30-minute chart
- As bulls are trying to break above the 2,650.00 level a continuation to the 2,700.00 figure is now on the cards.
- Support can be seen at the 2,600.00 figure.
Additional key levels
SP 500
Overview:
Today Last Price: 2651.5
Today Daily change: 1350 pips
Today Daily change %: 0.512%
Today Daily Open: 2638
Trends:
Daily SMA20: 2518.84
Daily SMA50: 2618.65
Daily SMA100: 2724.61
Daily SMA200: 2751.8
Levels:
Previous Daily High: 2645.25
Previous Daily Low: 2596.25
Previous Weekly High: 2598.75
Previous Weekly Low: 2523.5
Previous Monthly High: 2813.5
Previous Monthly Low: 2340.25
Daily Fibonacci 38.2%: 2626.53
Daily Fibonacci 61.8%: 2614.97
Daily Pivot Point S1: 2607.75
Daily Pivot Point S2: 2577.5
Daily Pivot Point S3: 2558.75
Daily Pivot Point R1: 2656.75
Daily Pivot Point R2: 2675.5
Daily Pivot Point R3: 2705.75
