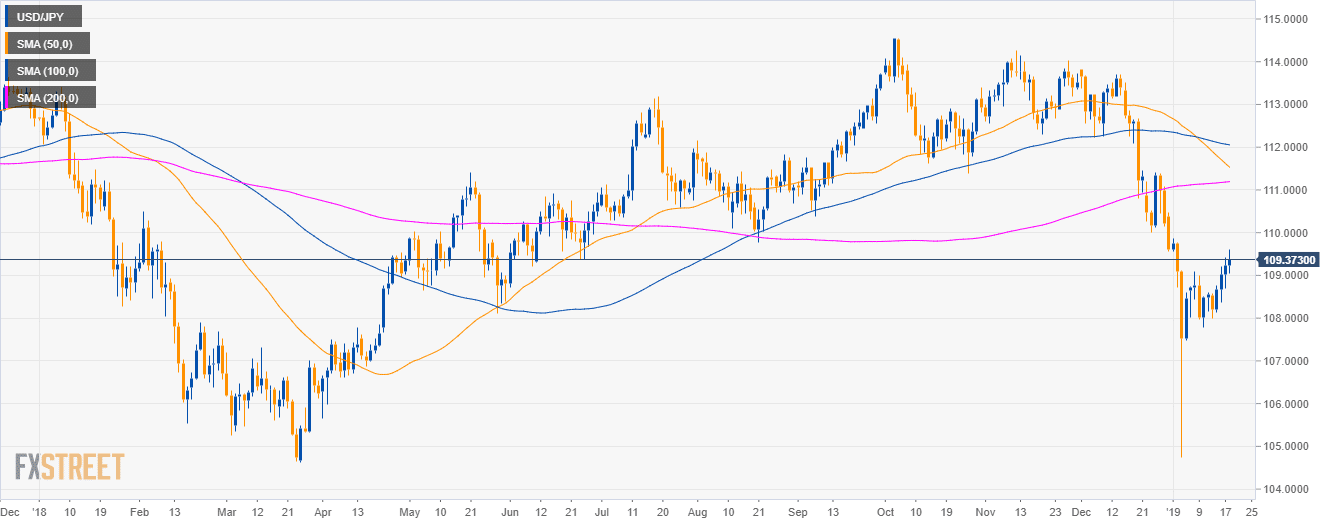
USD/JPY daily chart
- USD/JPY is trading in a deep pullback below the 50, 100 and 200-period simple moving averages (SMAs).
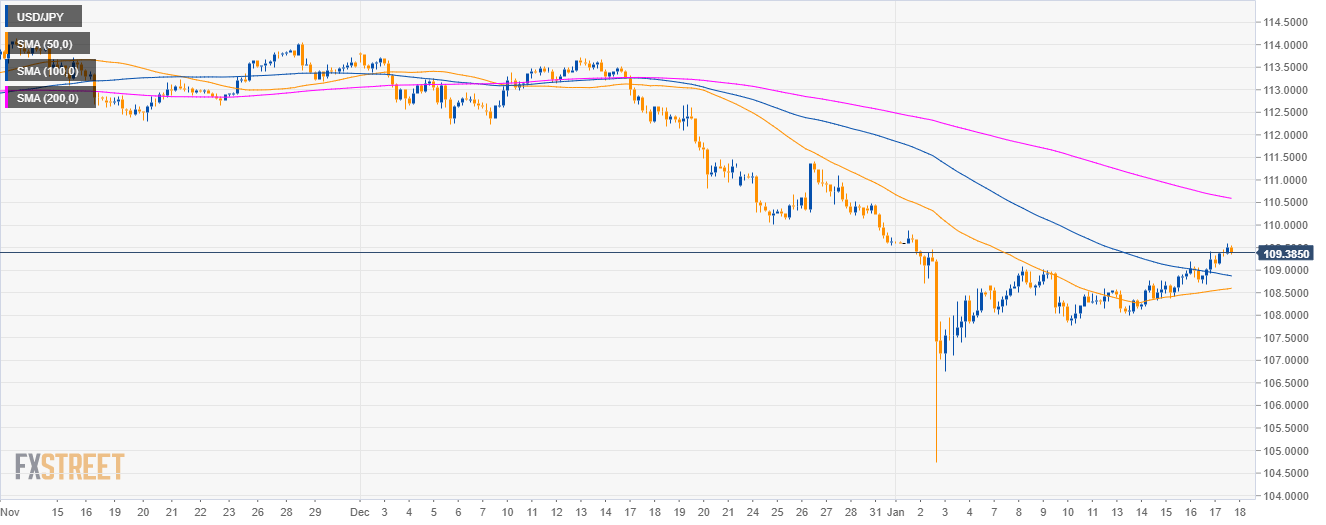
USD/JPY 4-hour chart
- The market is currently trading above the 50 and 100 SMA.
USD/JPY 30-minute chart
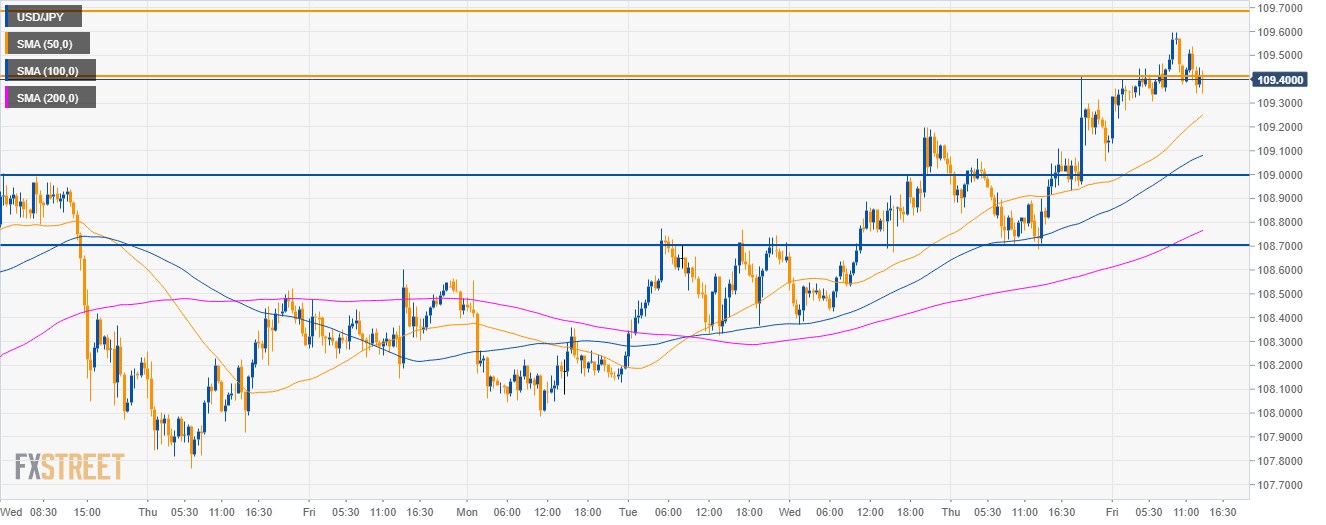
- Bears are likely to drive the market to 109.00 figure as 109.70 is seen as resistance.
Additional key levels
USD/JPY
Overview:
Today Last Price: 109.39
Today Daily change: 15 pips
Today Daily change %: 0.137%
Today Daily Open: 109.24
Trends:
Daily SMA20: 109.33
Daily SMA50: 111.62
Daily SMA100: 112.07
Daily SMA200: 111.18
Levels:
Previous Daily High: 109.41
Previous Daily Low: 108.68
Previous Weekly High: 109.09
Previous Weekly Low: 107.77
Previous Monthly High: 113.83
Previous Monthly Low: 109.55
Daily Fibonacci 38.2%: 109.13
Daily Fibonacci 61.8%: 108.96
Daily Pivot Point S1: 108.81
Daily Pivot Point S2: 108.38
Daily Pivot Point S3: 108.08
Daily Pivot Point R1: 109.54
Daily Pivot Point R2: 109.84
Daily Pivot Point R3: 110.27
