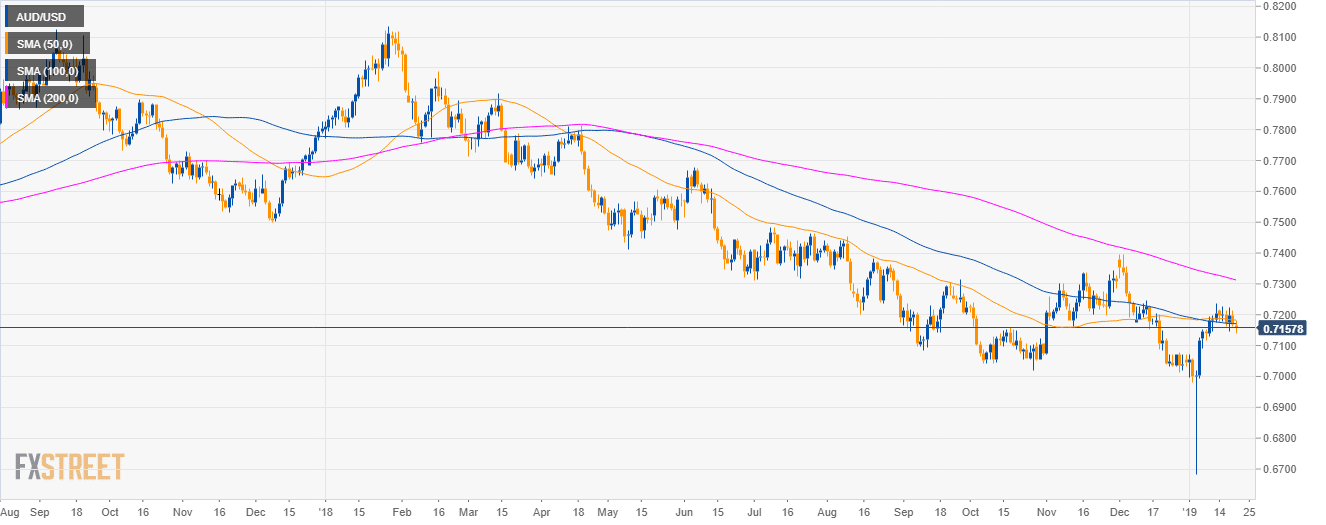
AUD/USD daily chart
- AUD/USD is in a bear trend below the 200 SMA.
- As discussed, the Aussie had a mild decline to the 0.7150 level.
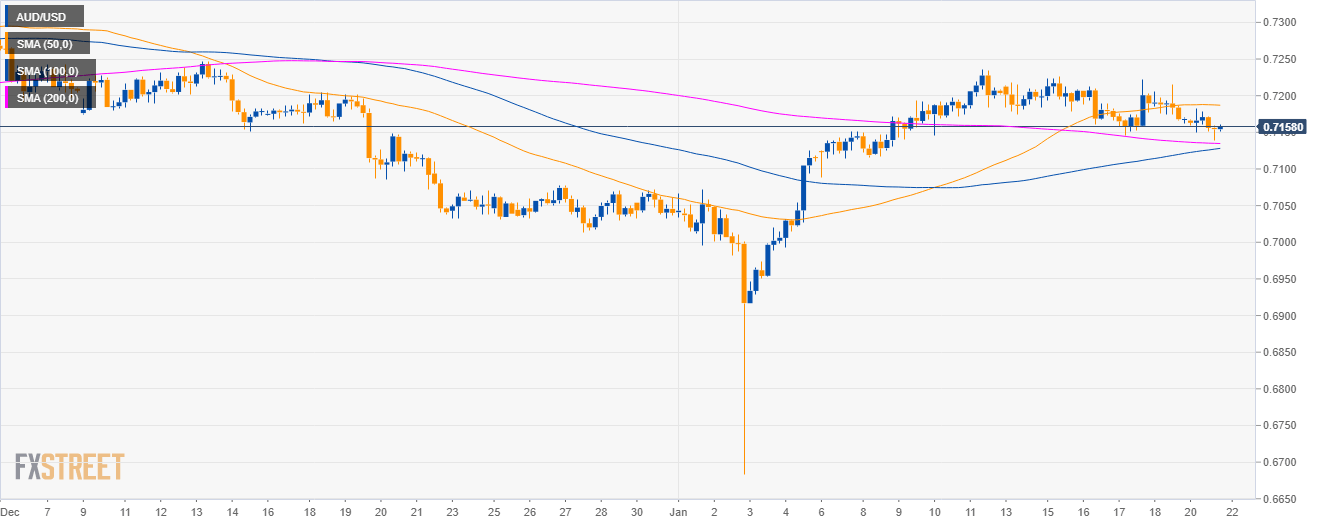
AUD/USD 4-hour chart
- AUD/USD is trading above the 100 and 200 SMAs.
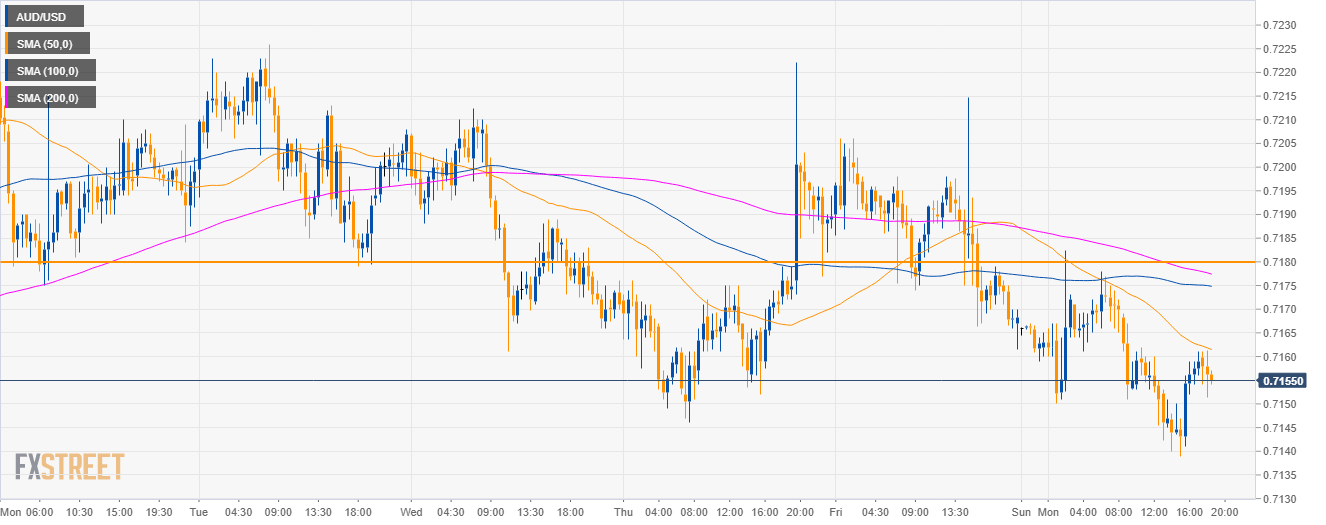
AUD/USD 30-minute chart
- AUD/USD is trading below its main SMAs suggesting bearish momentum.
- Bears are likely to drive the market down to the 0.7120 level.
- On the flip side, 0.7180 is seen as resistance and is the level to beat for bulls.
Additional key levels
AUD/USD
Overview:
Today Last Price: 0.7156
Today Daily change: -0.0012 pips
Today Daily change %: -0.17%
Today Daily Open: 0.7168
Trends:
Daily SMA20: 0.7112
Daily SMA50: 0.7183
Daily SMA100: 0.7172
Daily SMA200: 0.7317
Levels:
Previous Daily High: 0.7215
Previous Daily Low: 0.7161
Previous Weekly High: 0.7226
Previous Weekly Low: 0.7146
Previous Monthly High: 0.7394
Previous Monthly Low: 0.7014
Daily Fibonacci 38.2%: 0.7182
Daily Fibonacci 61.8%: 0.7194
Daily Pivot Point S1: 0.7148
Daily Pivot Point S2: 0.7128
Daily Pivot Point S3: 0.7095
Daily Pivot Point R1: 0.7202
Daily Pivot Point R2: 0.7235
Daily Pivot Point R3: 0.7255
