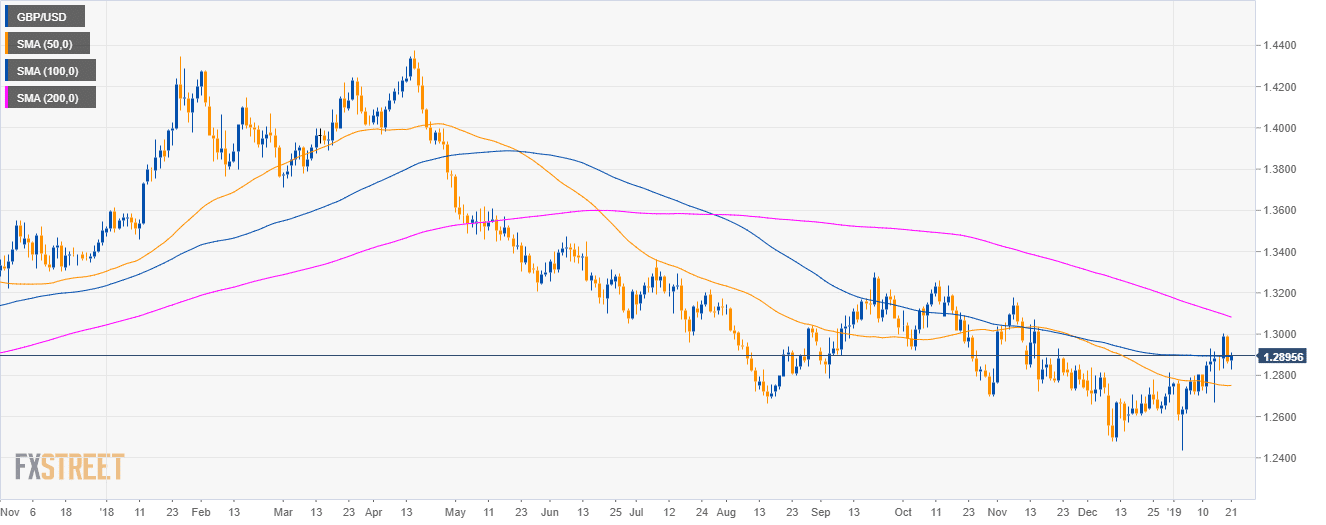
GBP/USD daily chart
- GBP/USD is in a bear trend below its 200-day simple moving averages (SMA).
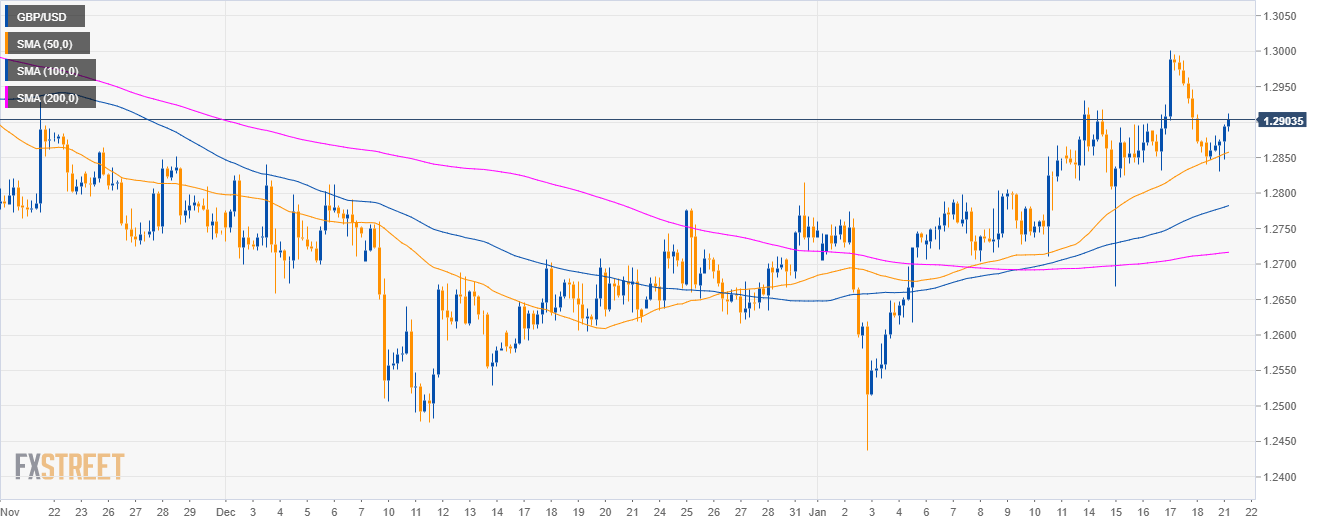
GBP/USD 4-hour chart
- GBP/USD is trading above the 50, 100 and 200 SMAs, suggesting bullish momentum in the medium-term.
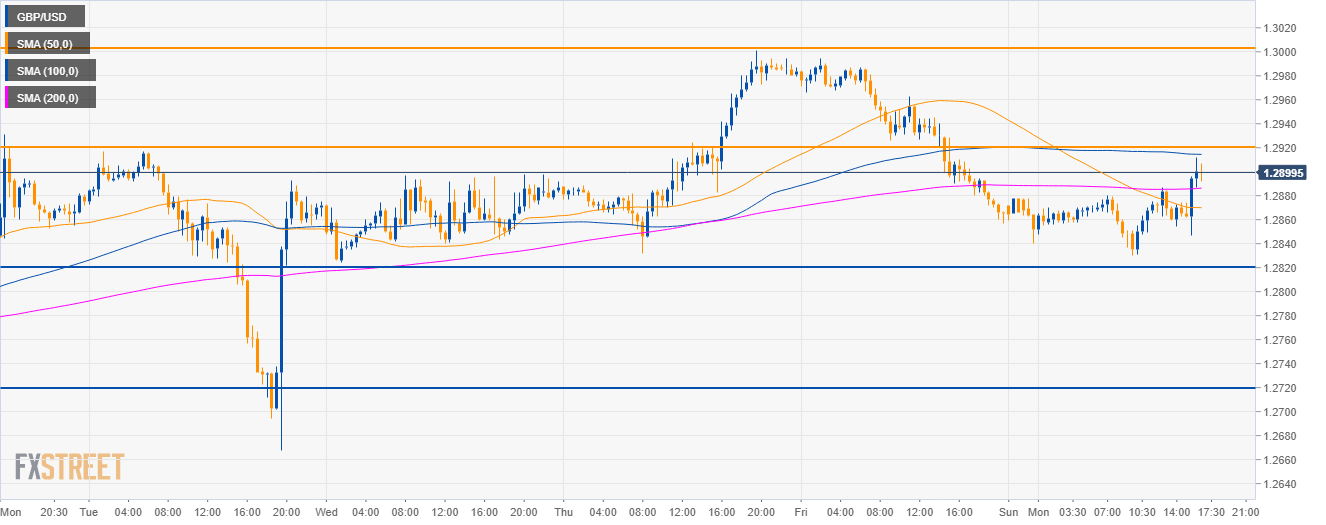
GBP/USD 30-minute chart
- Bulls reclaimed the 50 and 200 SMA suggesting bullish momentum as the market is challenging the 1.2900 figure.
- A break of 1.2920 resistance would open the door to a retest of 1.3000 the figure.
- On the flip side, support is seen at 1.2820 and the 1.2720 level.
Additional key levels
GBP/USD
Overview:
Today Last Price: 1.2903
Today Daily change: 0.0038 pips
Today Daily change %: 0.30%
Today Daily Open: 1.2865
Trends:
Daily SMA20: 1.2762
Daily SMA50: 1.275
Daily SMA100: 1.2891
Daily SMA200: 1.3092
Levels:
Previous Daily High: 1.2994
Previous Daily Low: 1.2857
Previous Weekly High: 1.3002
Previous Weekly Low: 1.2668
Previous Monthly High: 1.284
Previous Monthly Low: 1.2477
Daily Fibonacci 38.2%: 1.2909
Daily Fibonacci 61.8%: 1.2942
Daily Pivot Point S1: 1.2816
Daily Pivot Point S2: 1.2768
Daily Pivot Point S3: 1.2679
Daily Pivot Point R1: 1.2954
Daily Pivot Point R2: 1.3043
Daily Pivot Point R3: 1.3092
