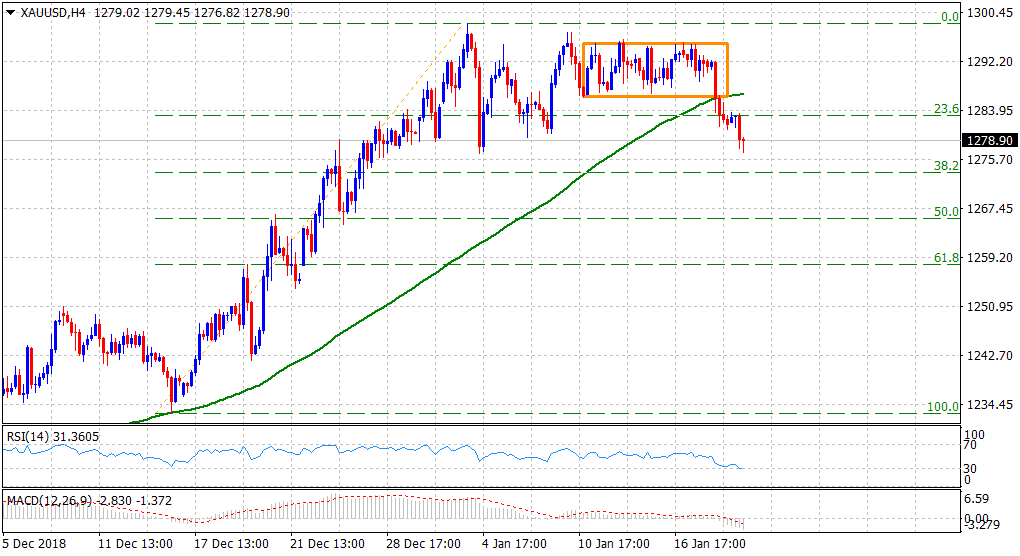
“¢ The precious metal extended last week’s bearish break through confluence support and fell to over two-week lows on the first trading day of a new week.
“¢ The mentioned support comprised of 4-hourly 100-period SMA and the lower end of a near one-week-old trading range, forming a rectangular chart pattern.
“¢ A subsequent bearish acceptance below 23.6% Fibo. level of the $1232.95-$1298.56 confirmed that the commodity might have already topped out in the near-term.
“¢ Oscillators on hourly charts are holding in the negative territory and have also started losing positive momentum on the daily chart, adding credence to the bearish bias.
“¢ Hence, a follow-through weakness below the $1277-76 region should pave the way for further near-term downfall towards 38.2% Fibo. level support near the $1273 region.
Gold 4-hourly chart
XAU/USD
Overview:
Today Last Price: 1279.08
Today Daily change %: -0.13%
Today Daily Open: 1280.8
Trends:
Daily SMA20: 1283.9
Daily SMA50: 1252.63
Daily SMA100: 1233
Daily SMA200: 1228.8
Levels:
Previous Daily High: 1292.56
Previous Daily Low: 1280.65
Previous Weekly High: 1295.9
Previous Weekly Low: 1276.2
Previous Monthly High: 1284.7
Previous Monthly Low: 1221.39
Daily Fibonacci 38.2%: 1285.2
Daily Fibonacci 61.8%: 1288.01
Daily Pivot Point S1: 1276.78
Daily Pivot Point S2: 1272.76
Daily Pivot Point S3: 1264.88
Daily Pivot Point R1: 1288.69
Daily Pivot Point R2: 1296.57
Daily Pivot Point R3: 1300.59
