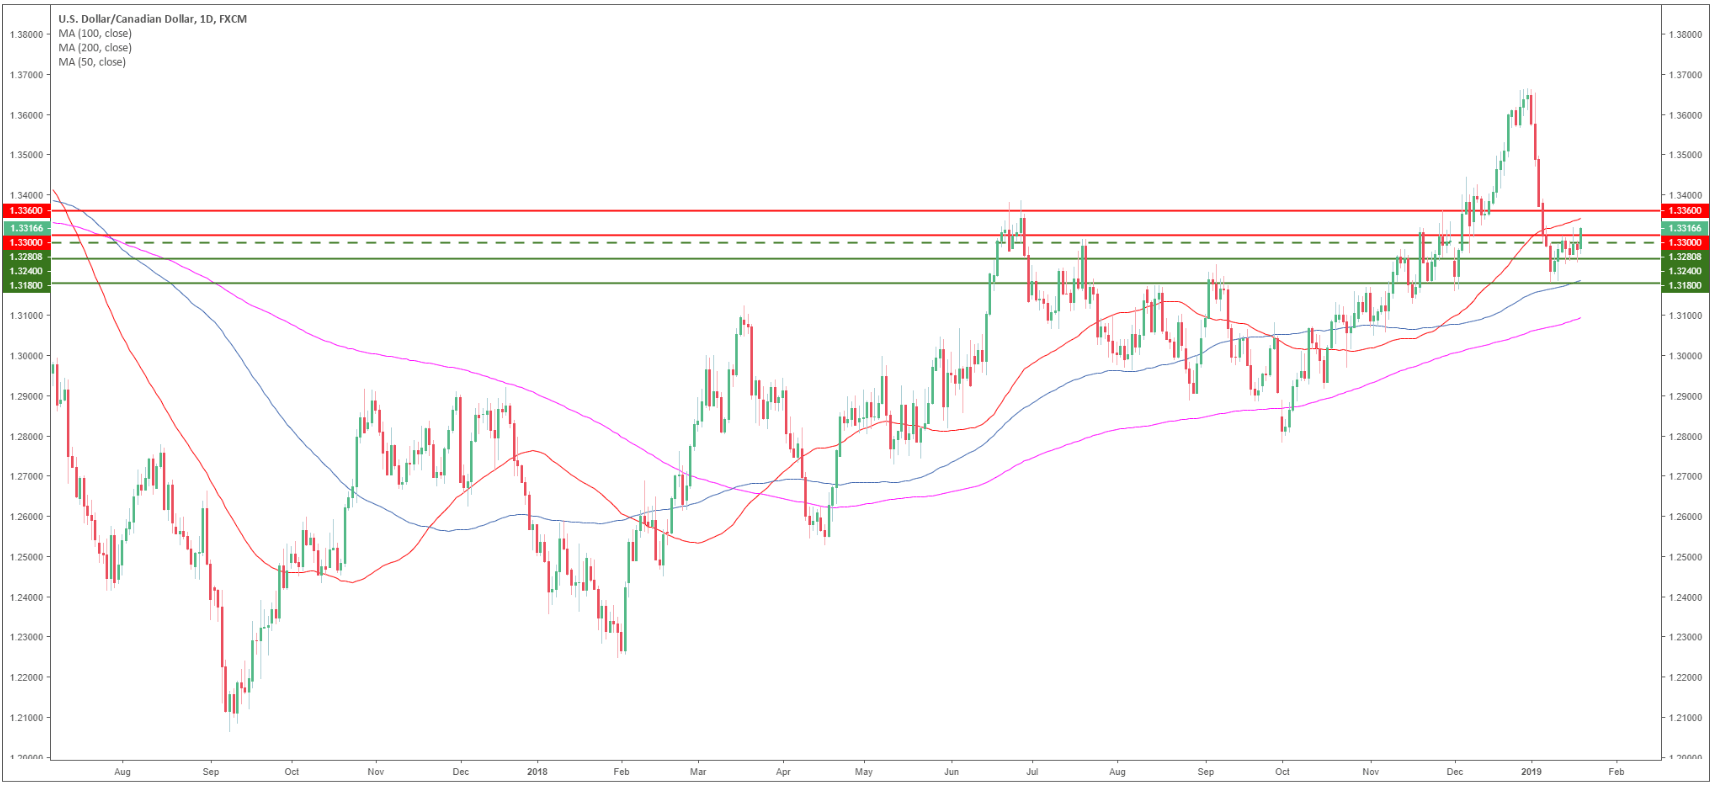
USD/CAD daily chart
- USD/CAD is trading in a bull trend above the 100 and 200-day simple moving averages (SMAs).
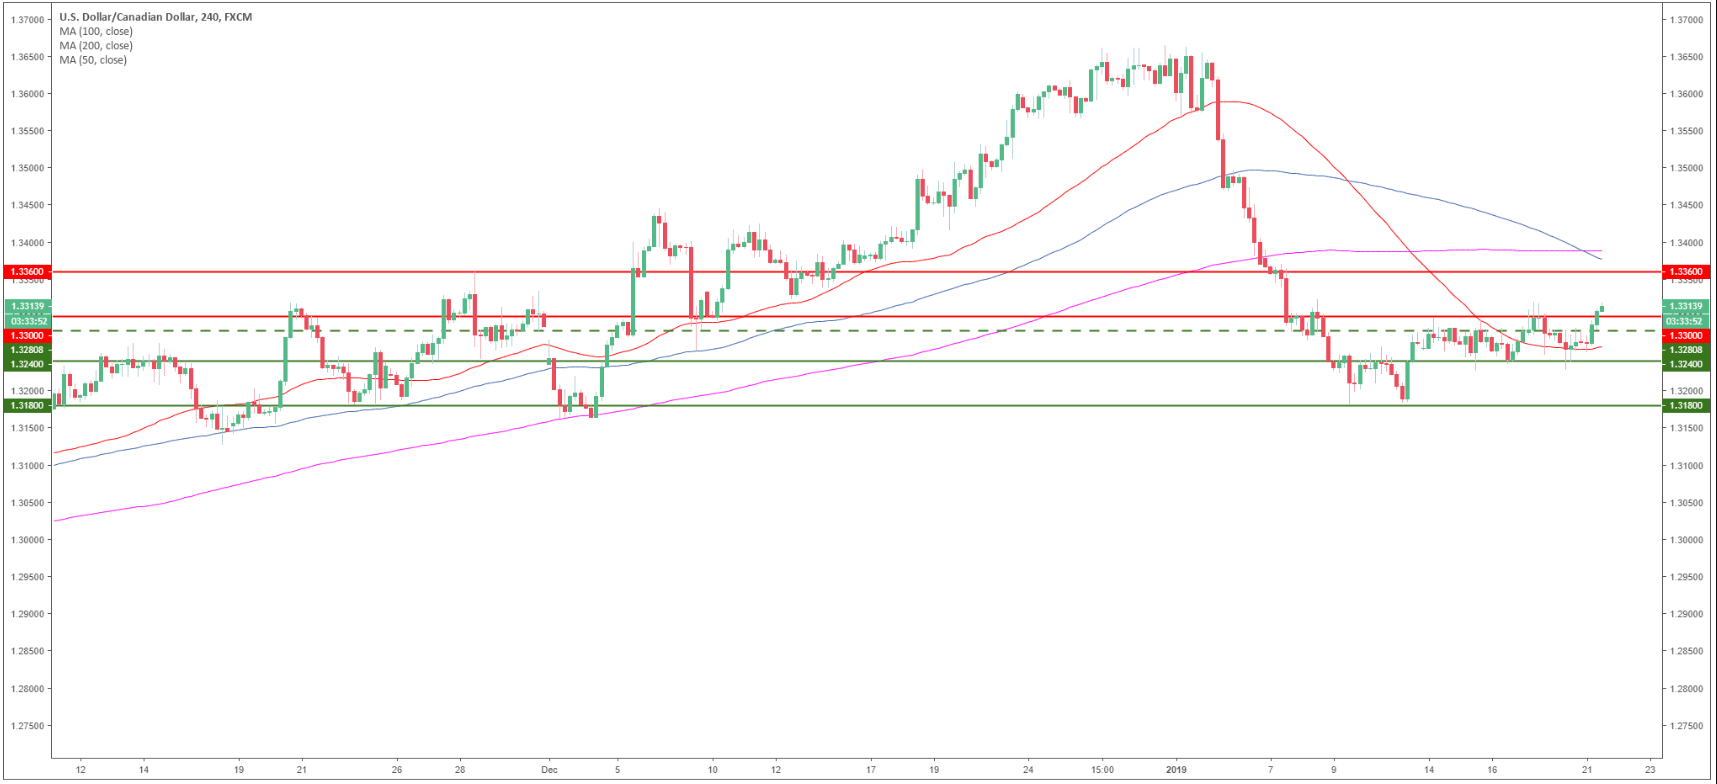
USD/CAD 4-hour chart
- USD/CAD bulls regained control above the 50 SMA as the market is now trading above the 1.3300 psychological mark.
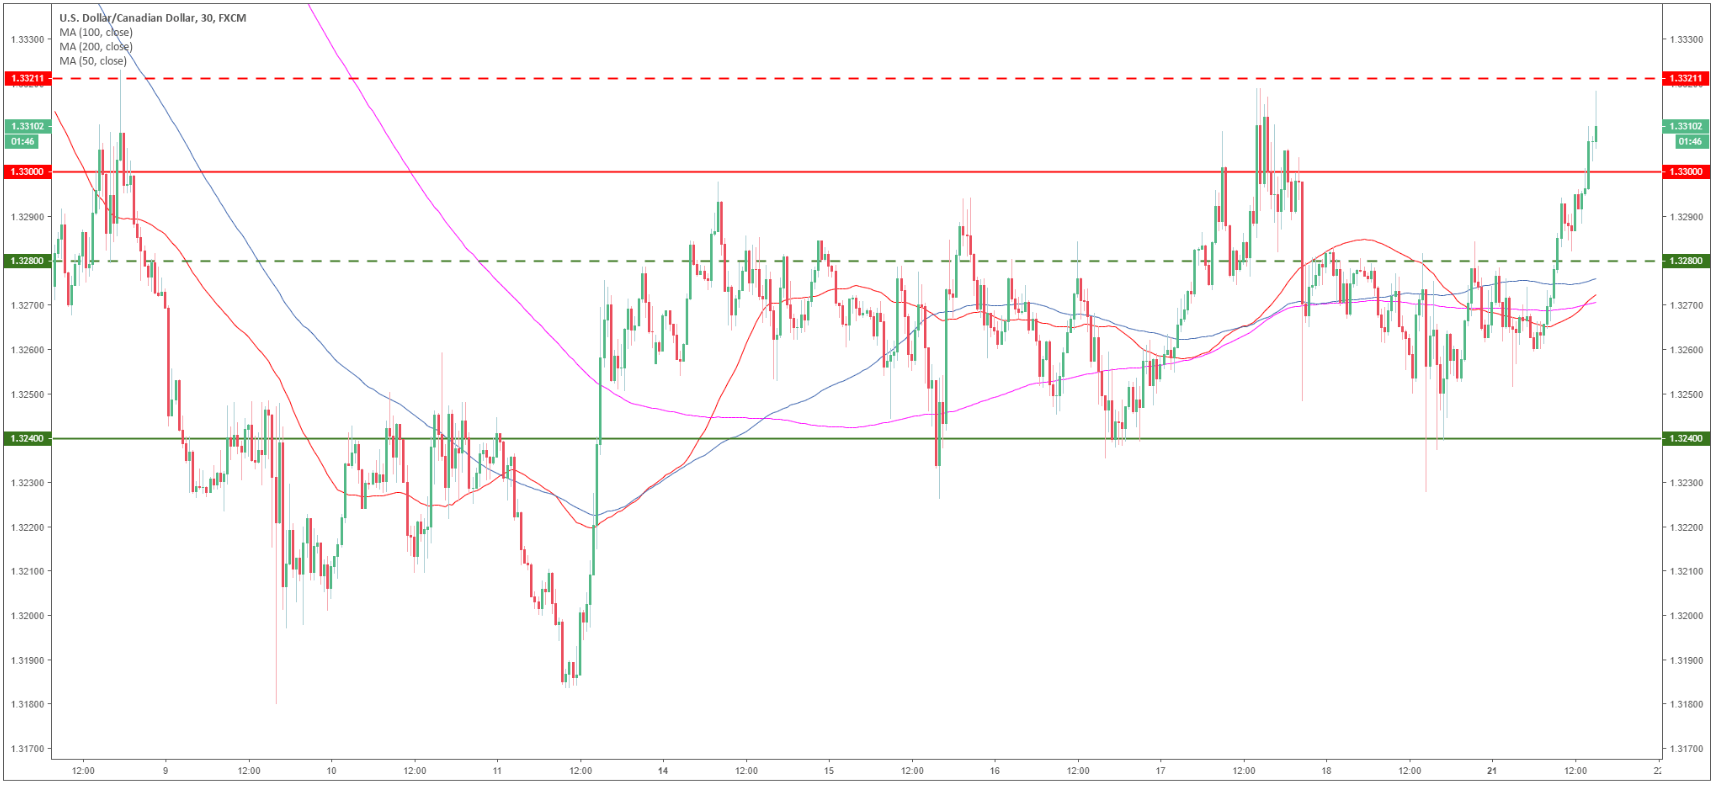
USD/CAD 30-minute chart
- In the short-term, 1.3220 is offering resistance as the next bear target is at the 1.3280 level.
Additional key levels
USD/CAD
Overview:
Today Last Price: 1.3311
Today Daily change: 0.0035 pips
Today Daily change %: 0.26%
Today Daily Open: 1.3276
Trends:
Daily SMA20: 1.3447
Daily SMA50: 1.3369
Daily SMA100: 1.3203
Daily SMA200: 1.3101
Levels:
Previous Daily High: 1.3285
Previous Daily Low: 1.3232
Previous Weekly High: 1.332
Previous Weekly Low: 1.3226
Previous Monthly High: 1.4134
Previous Monthly Low: 1.316
Daily Fibonacci 38.2%: 1.3265
Daily Fibonacci 61.8%: 1.3252
Daily Pivot Point S1: 1.3243
Daily Pivot Point S2: 1.3211
Daily Pivot Point S3: 1.319
Daily Pivot Point R1: 1.3297
Daily Pivot Point R2: 1.3318
Daily Pivot Point R3: 1.335
