The USD/JPY pair is currently trading at 109.56 – down 0.18 percent on the day – and could drop further toward the ascending (bullish) 5-day moving average (MA), currently at 109.26, courtesy of the bearish divergence of the 14-hour relative strength index (RSI).
Hourly chart
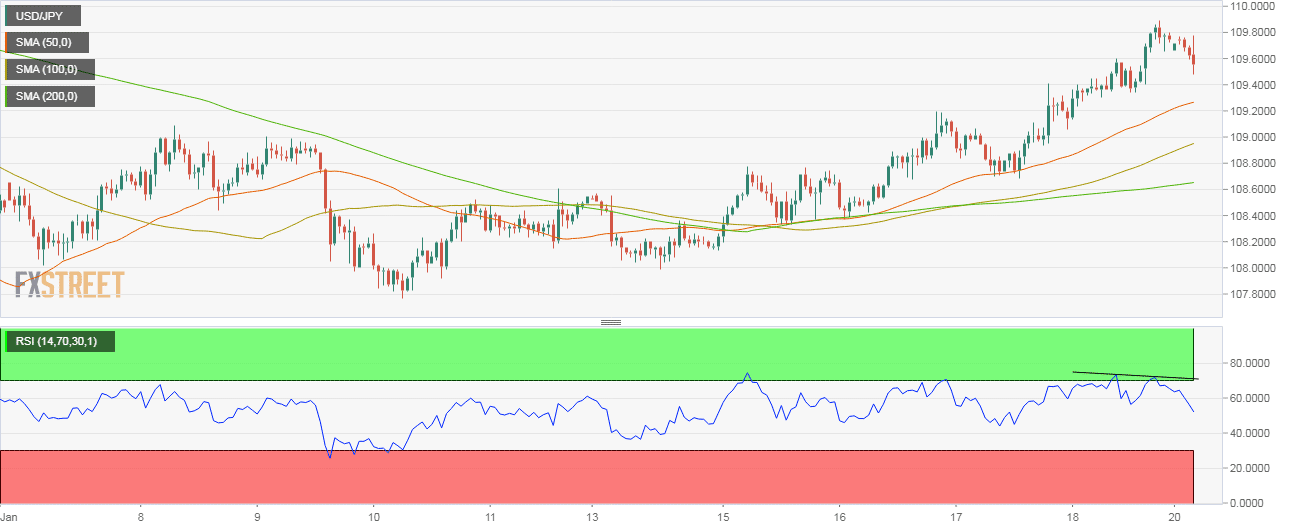
- The RSI is threatening to drop below 50.00 (in the bearish territory), having charted on Friday a lower high as opposed to a higher high on price.
- The major averages (50, 100 and 200) are trending north and located one above the other, signaling that the path of least resistance is on the higher side.
- The dollar, therefore, could find bids at the ascending 5-day MA of 109.26.
Trend: pullback underway
USD/JPY
Overview:
Today Last Price: 109.56
Today Daily change: -0.19 pips
Today Daily change %: -0.17%
Today Daily Open: 109.75
Trends:
Daily SMA20: 109.25
Daily SMA50: 111.54
Daily SMA100: 112.06
Daily SMA200: 111.19
Levels:
Previous Daily High: 109.9
Previous Daily Low: 109.06
Previous Weekly High: 109.9
Previous Weekly Low: 107.99
Previous Monthly High: 113.83
Previous Monthly Low: 109.55
Daily Fibonacci 38.2%: 109.57
Daily Fibonacci 61.8%: 109.38
Daily Pivot Point S1: 109.24
Daily Pivot Point S2: 108.73
Daily Pivot Point S3: 108.4
Daily Pivot Point R1: 110.08
Daily Pivot Point R2: 110.41
Daily Pivot Point R3: 110.92
