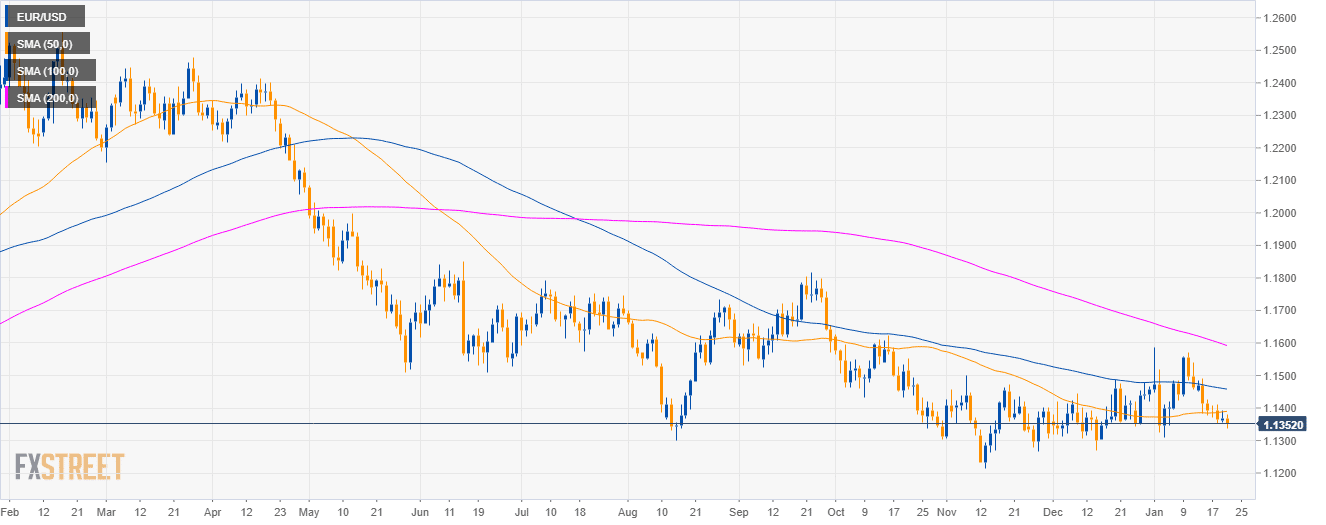
EUR/USD daily chart
- EUR/USD is trading in a bear trend below its 200-day simple moving averages (SMA) on the daily chart.
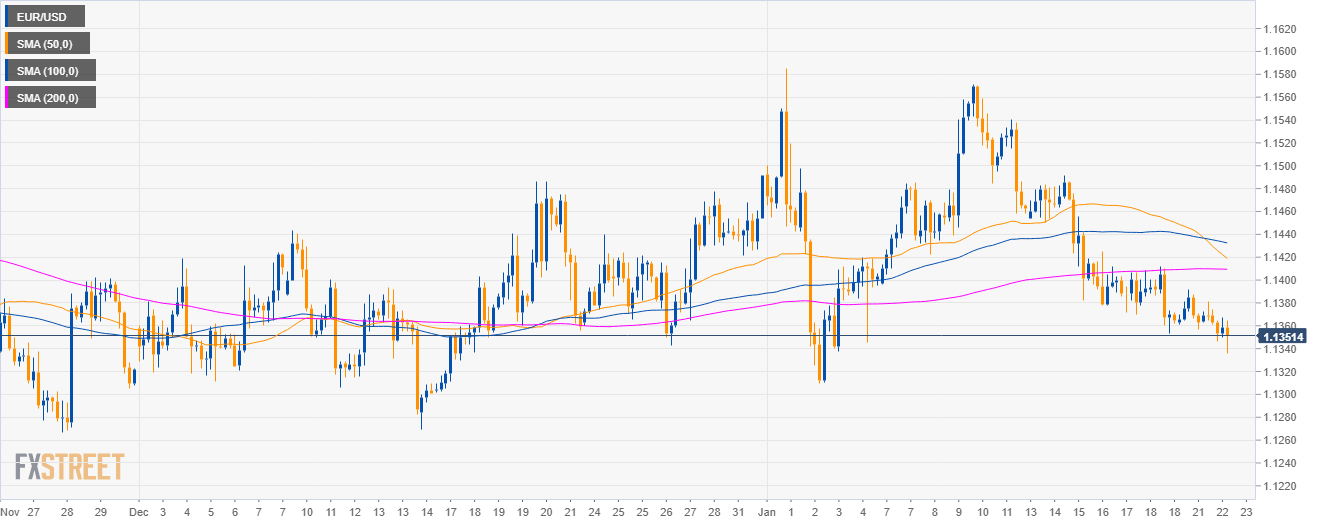
EUR/USD 4-hour chart
- Fiber is trading below the 50, 100 and 200 SMAs near the 2019 lows.
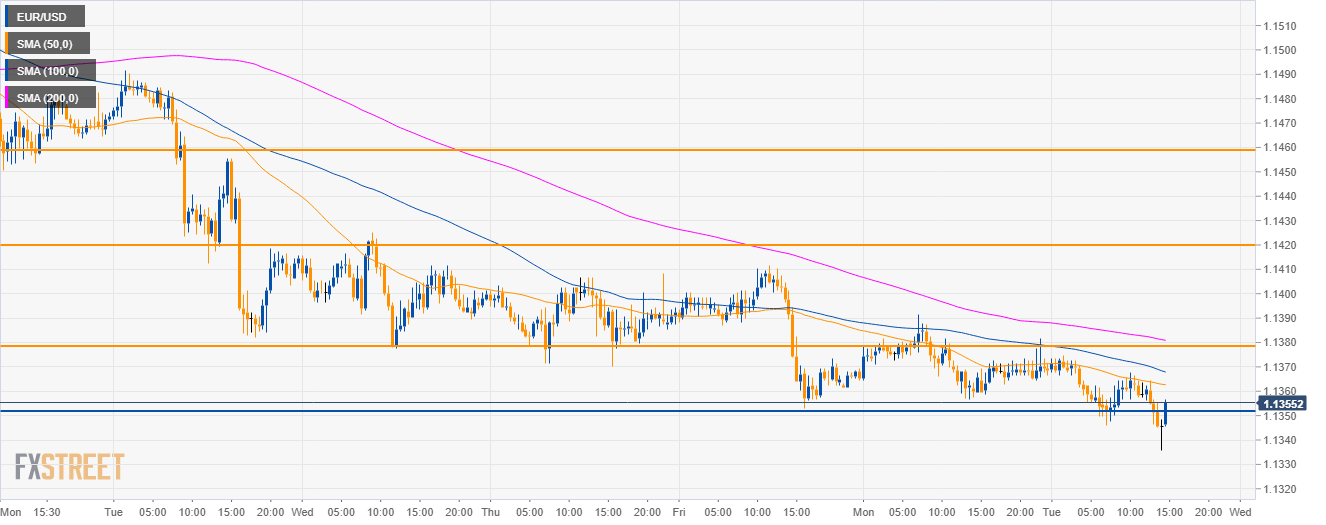
EUR/USD 30-minute chart
- Although EUR/USD is making new lows and trading below the main SMAs, there is no conviction in the move down.
- Euro bulls are set to come back soon with 1.1380, 1.1420 and potentially 1.1460 target to the upside.
Additional key levels
EUR/USD
Overview:
Today Last Price: 1.1355
Today Daily change: -0.0014 pips
Today Daily change %: -0.12%
Today Daily Open: 1.1369
Trends:
Daily SMA20: 1.1428
Daily SMA50: 1.1388
Daily SMA100: 1.146
Daily SMA200: 1.1599
Levels:
Previous Daily High: 1.1392
Previous Daily Low: 1.1357
Previous Weekly High: 1.1491
Previous Weekly Low: 1.1353
Previous Monthly High: 1.1486
Previous Monthly Low: 1.1269
Daily Fibonacci 38.2%: 1.1378
Daily Fibonacci 61.8%: 1.137
Daily Pivot Point S1: 1.1353
Daily Pivot Point S2: 1.1338
Daily Pivot Point S3: 1.1318
Daily Pivot Point R1: 1.1388
Daily Pivot Point R2: 1.1407
Daily Pivot Point R3: 1.1423
