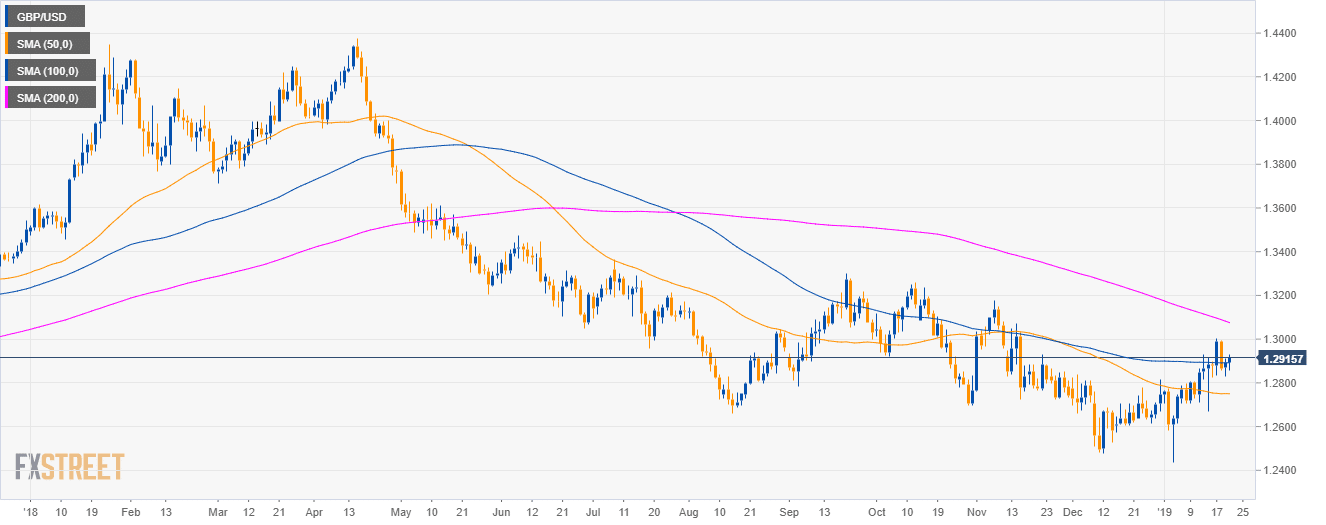
GBP/USD daily chart
- GBP/USD is evolving in a bear trend below its 200-day simple moving averages (SMA) on the daily chart.
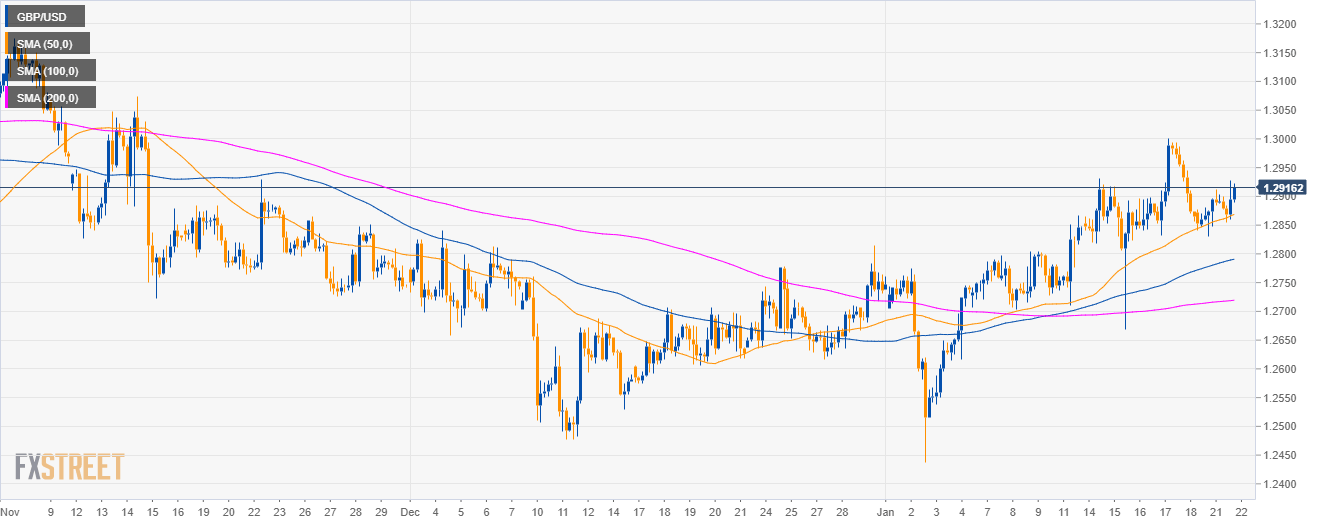
GBP/USD 4-hour chart
- Cable is above the 50, 100 and 200 SMAs, suggesting a bullish momentum in the medium-term.
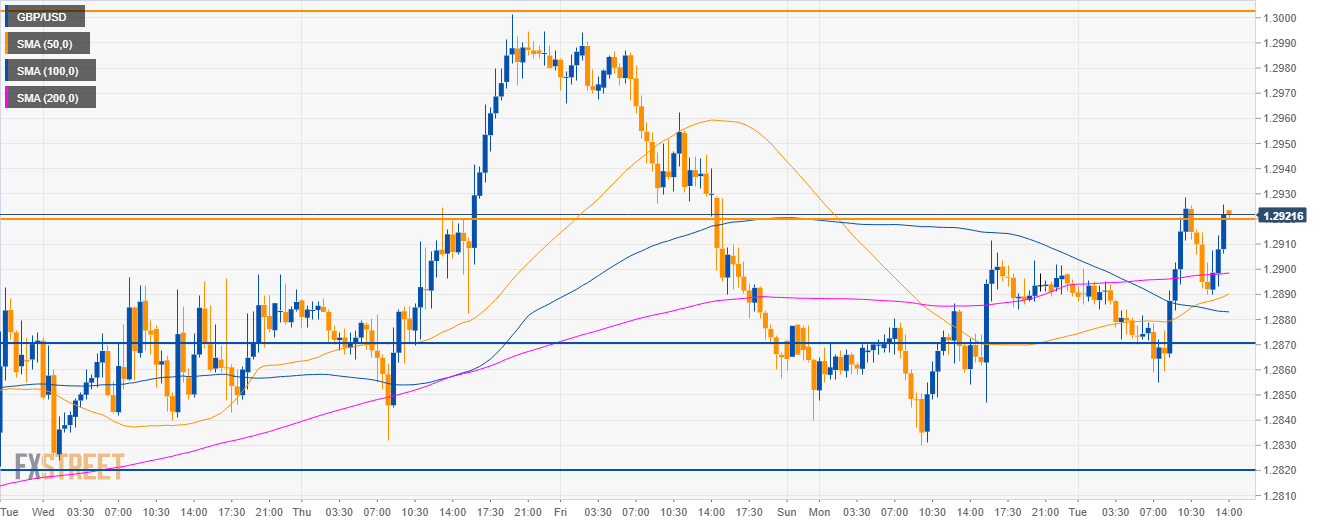
GBP/USD 30-minute chart
- GBP/USD is trading above its main SMAs suggesting bullish momentum.
- The 1.2920 resistance is the level to beat for bulls, a break of the level to the upside could lead to 1.3000 figure.
- To the downside, support is initially seen at 1.2870 and then at the 1.2820 level.
Additional key levels
GBP/USD
Overview:
Today Last Price: 1.2914
Today Daily change: 0.0020 pips
Today Daily change %: 0.16%
Today Daily Open: 1.2894
Trends:
Daily SMA20: 1.2771
Daily SMA50: 1.2751
Daily SMA100: 1.2891
Daily SMA200: 1.3086
Levels:
Previous Daily High: 1.2912
Previous Daily Low: 1.283
Previous Weekly High: 1.3002
Previous Weekly Low: 1.2668
Previous Monthly High: 1.284
Previous Monthly Low: 1.2477
Daily Fibonacci 38.2%: 1.288
Daily Fibonacci 61.8%: 1.2861
Daily Pivot Point S1: 1.2845
Daily Pivot Point S2: 1.2797
Daily Pivot Point S3: 1.2764
Daily Pivot Point R1: 1.2927
Daily Pivot Point R2: 1.296
Daily Pivot Point R3: 1.3008
