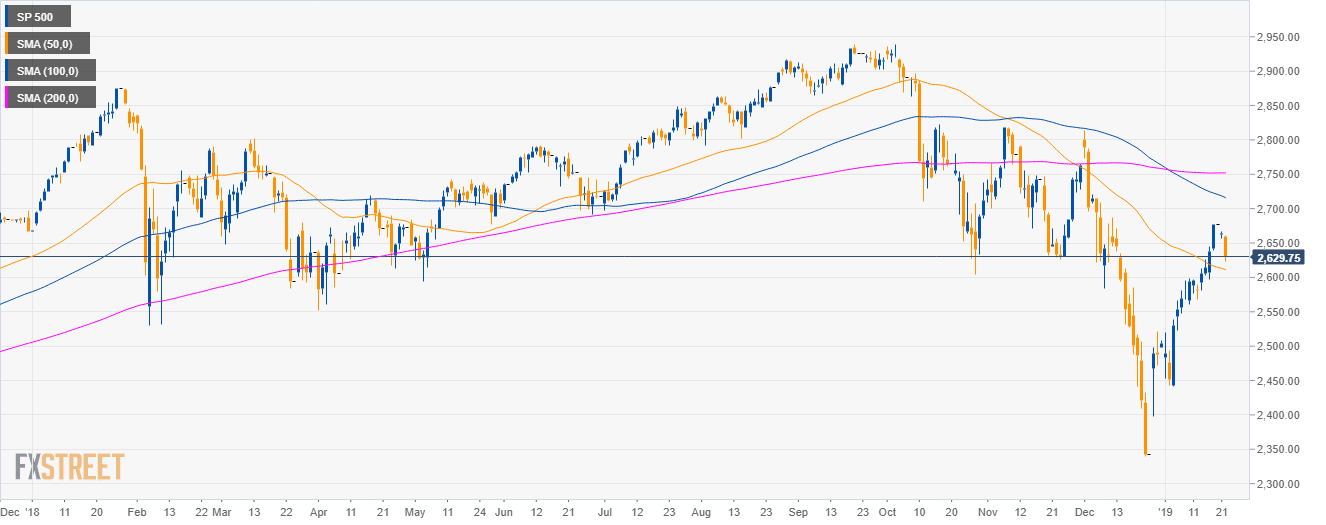
S&P500 daily chart
- The S&P500 Index is trading in a deep pullback below the 100 and 200-day simple moving averages (SMAs).
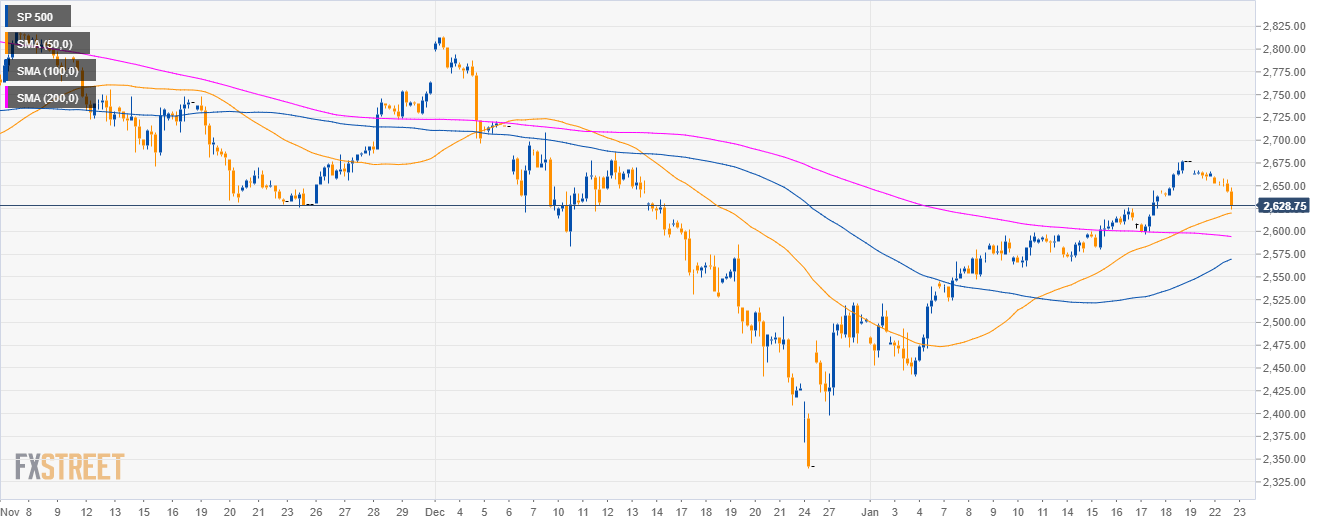
S&P500 4-hour chart
- The S&P500 is above the main SMAs suggesting bullish momentum in the near-term.
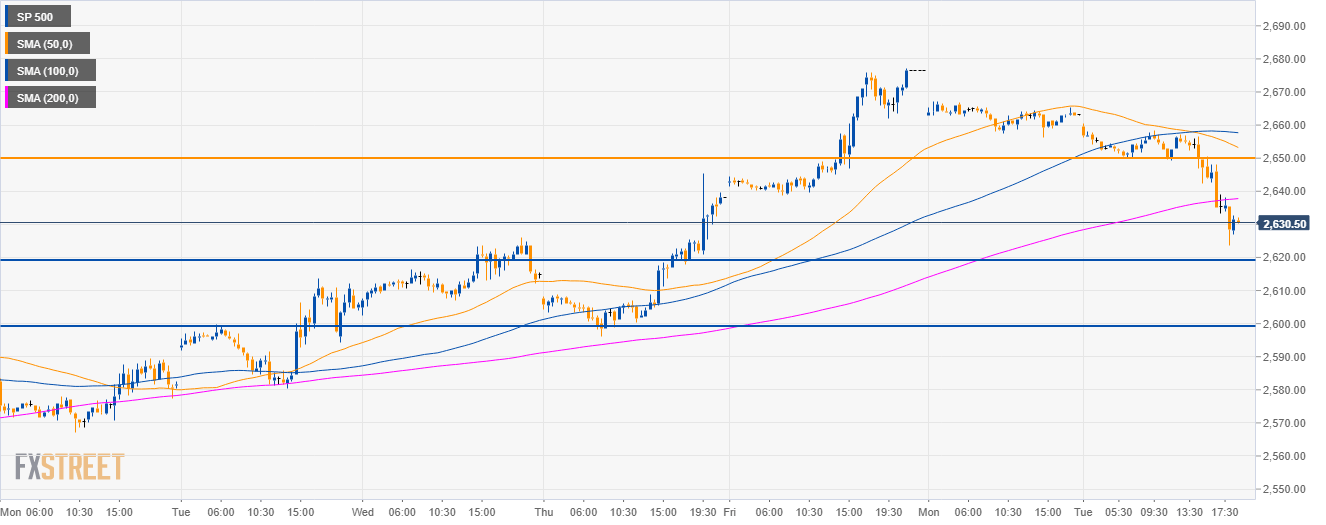
S&P500 30-minute chart
- The market broke below the 2,650.00 support and the 200 SMA suggesting bearish momentum in the near-term.
- If the market can continue its decline below the 2,620.00 support then bears can target the 2,600.00 figure to the downside.
- The 2,650.00 level is seen as resistance.
Additional key levels
SP 500
Overview:
Today Last Price: 2631.5
Today Daily change: -31.75 pips
Today Daily change %: -1.19%
Today Daily Open: 2663.25
Trends:
Daily SMA20: 2549.22
Daily SMA50: 2613.23
Daily SMA100: 2718.48
Daily SMA200: 2752
Levels:
Previous Daily High: 2667.25
Previous Daily Low: 2656.25
Previous Weekly High: 2677.25
Previous Weekly Low: 2567.25
Previous Monthly High: 2813.5
Previous Monthly Low: 2340.25
Daily Fibonacci 38.2%: 2663.05
Daily Fibonacci 61.8%: 2660.45
Daily Pivot Point S1: 2657.25
Daily Pivot Point S2: 2651.25
Daily Pivot Point S3: 2646.25
Daily Pivot Point R1: 2668.25
Daily Pivot Point R2: 2673.25
Daily Pivot Point R3: 2679.25
