- The greenback is extending its upside momentum so far this week, retaking the mid-96.00s and opening the door for a potential move higher in the short-term horizon.
- DXY has quickly reverted Monday’s retracement and has now resumed the upside to fresh 3-week tops near 96.50.
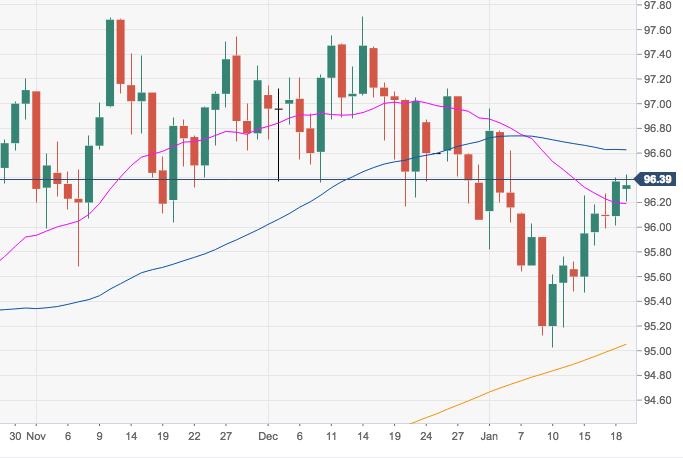
- Extra gains should face interim hurdle at the 55-day SMA, today at 96.60, ahead of the 23.6% Fibo retracement of the September-December up move at 96.79.
DXY daily chart
Dollar Index Spot
Overview:
Today Last Price: 96.37
Today Daily change: 0.03 pips
Today Daily change %: 0.03%
Today Daily Open: 96.34
Trends:
Daily SMA20: 96.15
Daily SMA50: 96.64
Daily SMA100: 96.08
Daily SMA200: 95.05
Levels:
Previous Daily High: 96.43
Previous Daily Low: 96.21
Previous Weekly High: 96.4
Previous Weekly Low: 95.47
Previous Monthly High: 97.71
Previous Monthly Low: 96.06
Daily Fibonacci 38.2%: 96.35
Daily Fibonacci 61.8%: 96.29
Daily Pivot Point S1: 96.22
Daily Pivot Point S2: 96.11
Daily Pivot Point S3: 96
Daily Pivot Point R1: 96.44
Daily Pivot Point R2: 96.55
Daily Pivot Point R3: 96.66
