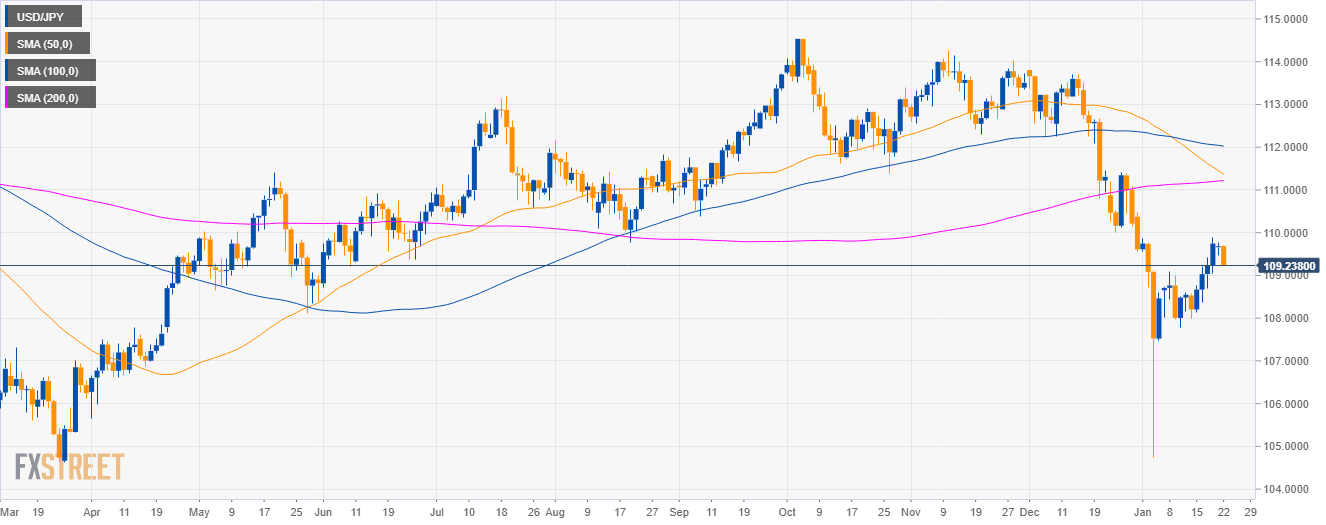
USD/JPY daily chart
- USD/JPY is trading in a deep pullback below the 50, 100 and 200-day simple moving averages (SMAs).
- As forecast, USD/JPY retraced to the 109.40 target.
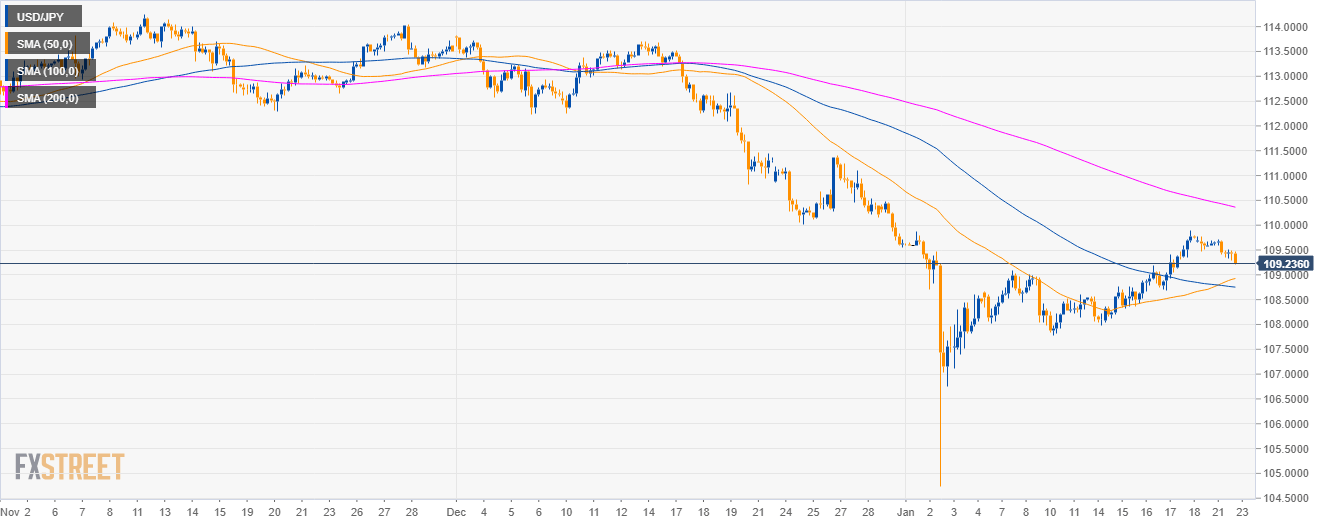
USD/JPY 4-hour chart
- USD/JPY is trading below its main 200 SMA.
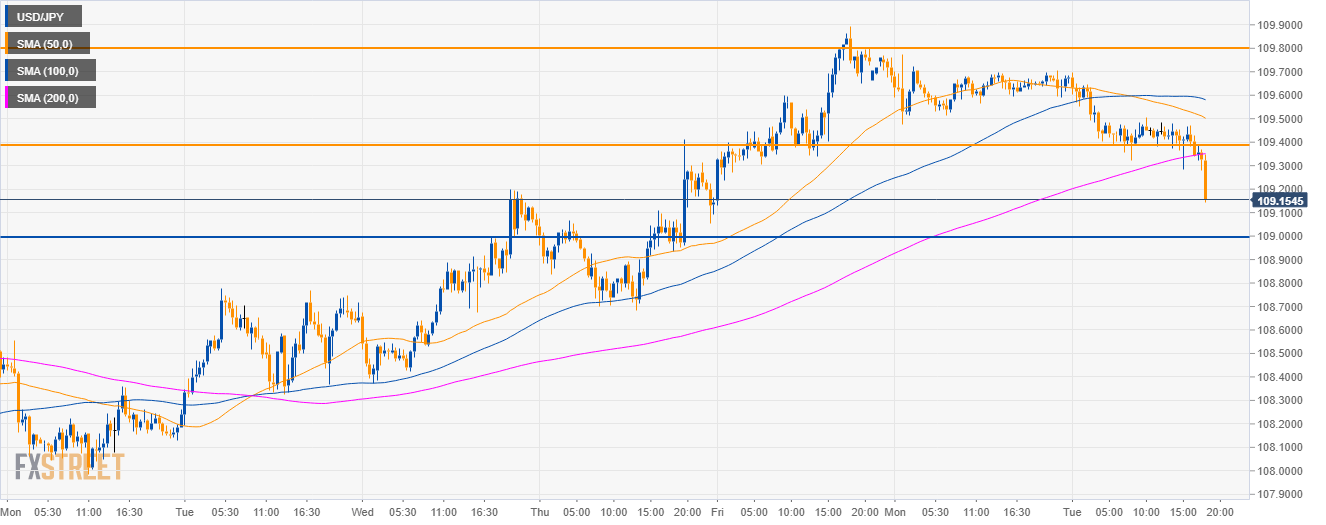
USD/JPY 30-minute chart
- As bears broke below the 109.40 support and the 200 SMA, USD/JPY is set to continue the decline to the 109.00 figure.
Additional key levels
USD/JPY
Overview:
Today Last Price: 109.18
Today Daily change: -0.50 pips
Today Daily change %: -0.46%
Today Daily Open: 109.68
Trends:
Daily SMA20: 109.21
Daily SMA50: 111.45
Daily SMA100: 112.05
Daily SMA200: 111.2
Levels:
Previous Daily High: 109.78
Previous Daily Low: 109.47
Previous Weekly High: 109.9
Previous Weekly Low: 107.99
Previous Monthly High: 113.83
Previous Monthly Low: 109.55
Daily Fibonacci 38.2%: 109.66
Daily Fibonacci 61.8%: 109.59
Daily Pivot Point S1: 109.51
Daily Pivot Point S2: 109.34
Daily Pivot Point S3: 109.21
Daily Pivot Point R1: 109.81
Daily Pivot Point R2: 109.94
Daily Pivot Point R3: 110.11
