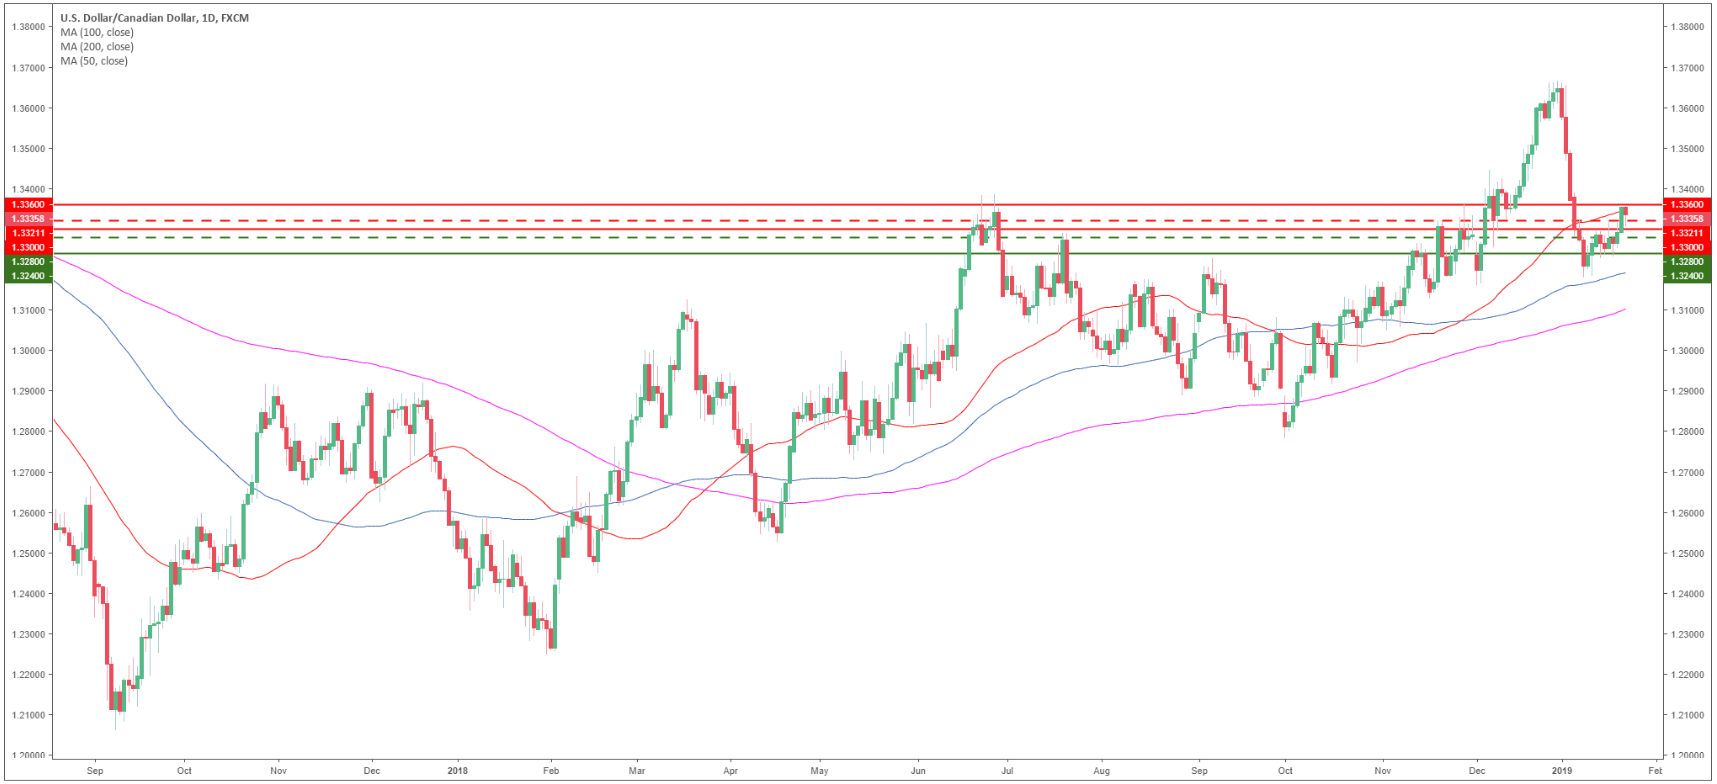
USD/CAD daily chart
- USD/CAD is trading in a bull trend above the 100 and 200-day simple moving averages (SMAs).
- The USD bulls are challenging the 50 SMA.
- Canada Retail sales declined 0.9% in November vs -0.6% expected.
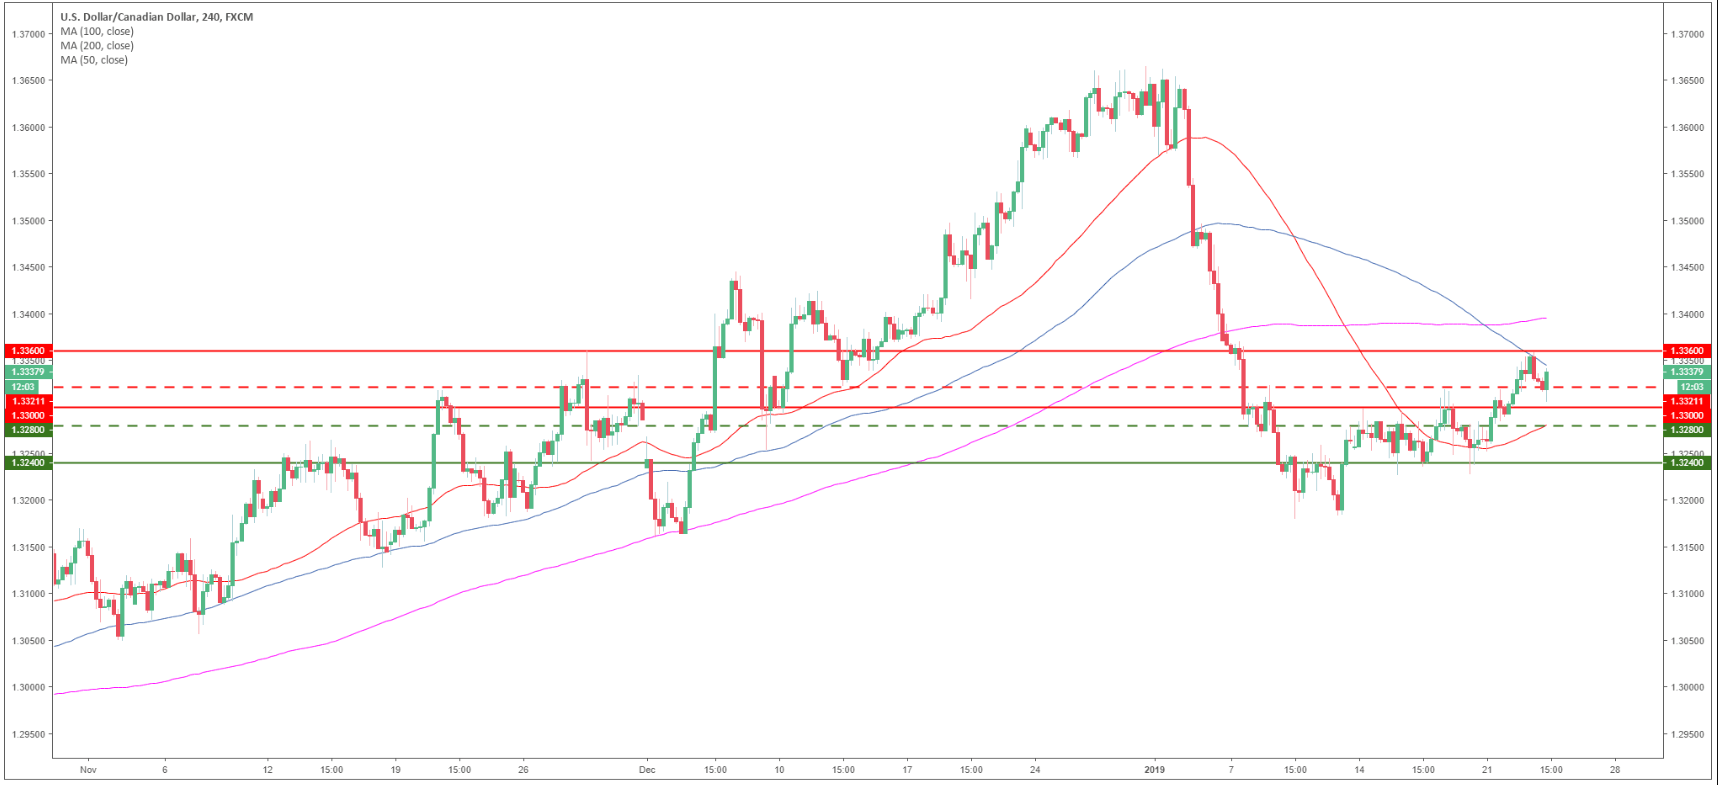
USD/CAD 4-hour chart
- USD/CAD is trading above the 50 SMA and the 1.3300 figure.
- USD/CAD found resistance near the 100 SMA.
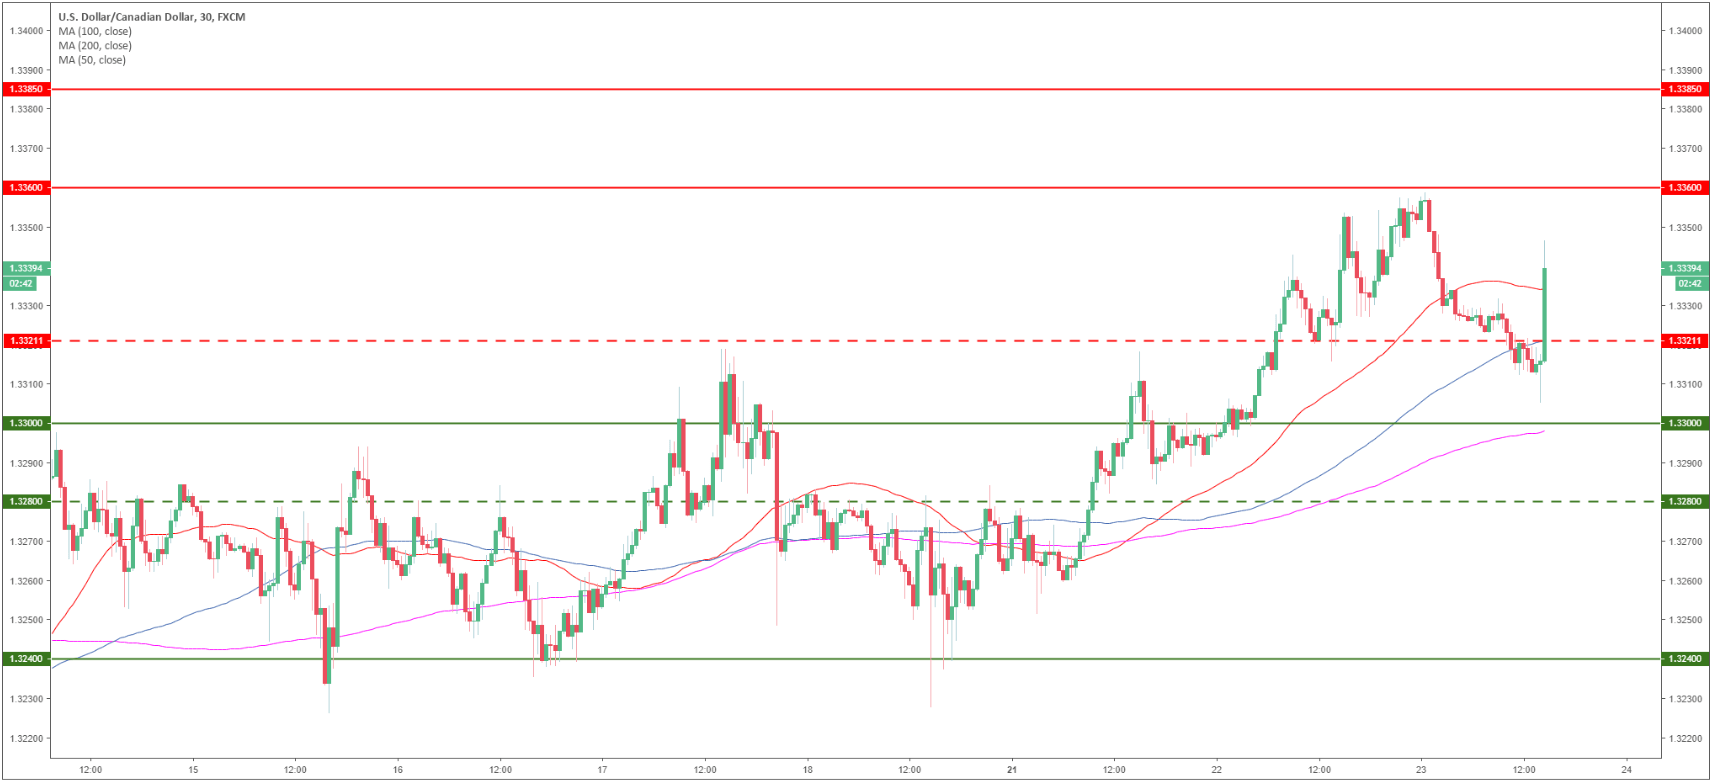
USD/CAD 30-minute chart
- USD/CAD is trading above its main SMAs suggesting bullish momentum.
- USD bulls are looking at the 1.3360 resistance followed by 1.3385 on a potential break of 1.3360.
- Support lies at 1.3320, 1.3000 and 1.3280.
Additional key levels
USD/CAD
Overview:
Today Last Price: 1.3333
Today Daily change: -22 pips
Today Daily change %: -0.16%
Today Daily Open: 1.3355
Trends:
Daily SMA20: 1.3395
Daily SMA50: 1.3372
Daily SMA100: 1.3208
Daily SMA200: 1.3108
Levels:
Previous Daily High: 1.3358
Previous Daily Low: 1.329
Previous Weekly High: 1.332
Previous Weekly Low: 1.3226
Previous Monthly High: 1.4134
Previous Monthly Low: 1.316
Daily Fibonacci 38.2%: 1.3333
Daily Fibonacci 61.8%: 1.3316
Daily Pivot Point S1: 1.3311
Daily Pivot Point S2: 1.3267
Daily Pivot Point S3: 1.3243
Daily Pivot Point R1: 1.3379
Daily Pivot Point R2: 1.3403
Daily Pivot Point R3: 1.3447
