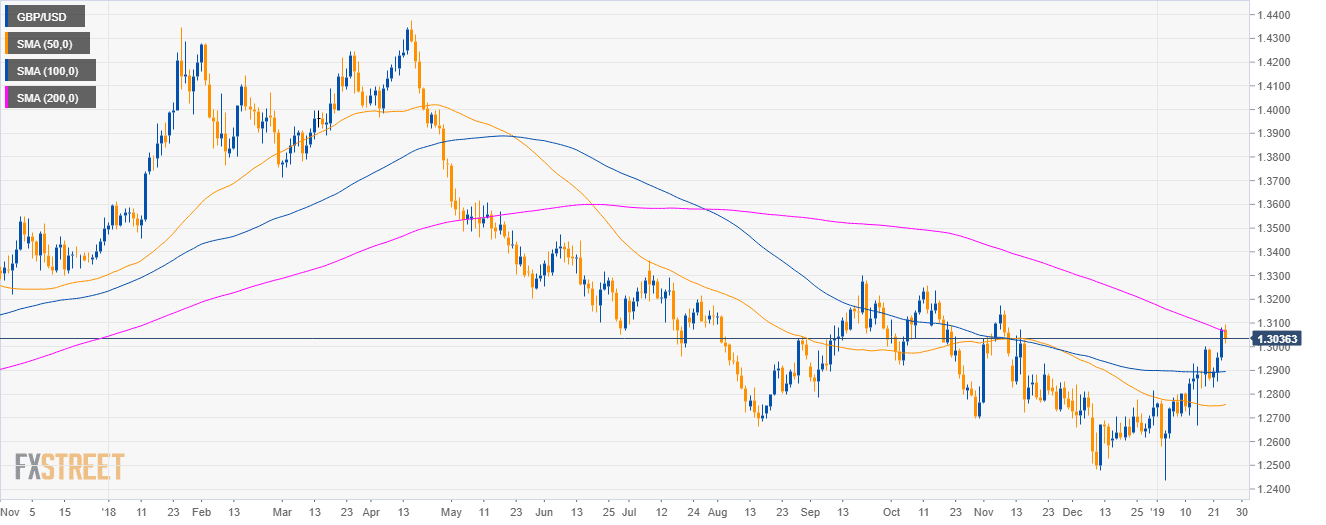
GBP/USD daily chart
- GBP/USD is trading in a bear trend below its 200-day simple moving averages (SMA) on the daily chart.
- However, buyers have broken above the 50 and 100 SMAs and they have tested the 200 SMA, all suggesting bullish momentum.
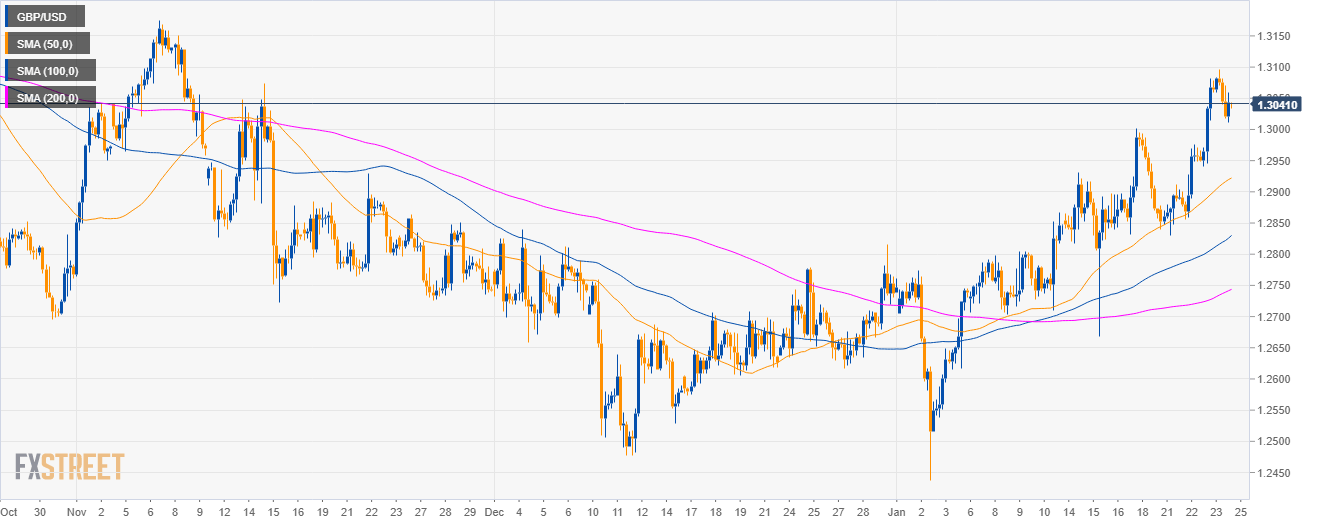
GBP/USD 4-hour chart
- GBP/USD is trading above the main SMAs and the 1.3000 psychological mark suggesting bullish strength in the medium-term.
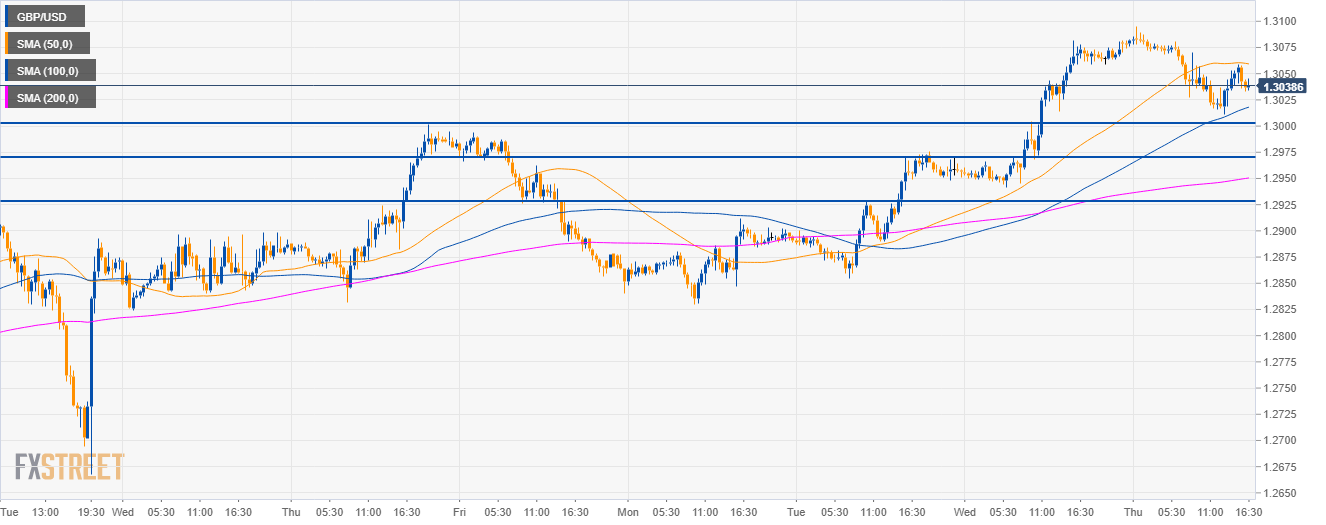
GBP/USD 30-minute chart
- GBP/USD is above its 100 and 200 SMAs suggesting bullish momentum
- Although the market can retrace towards 1.2930 in the short-term, the medium-term trend is to the upside with a target at the 1.3160 level.
- Support is seen at the 1.3000 figure, 1.2970 and the 1.2930 level.
Additional key levels
GBP/USD
Overview:
Today Last Price: 1.3039
Today Daily change: – 33 pips
Today Daily change %: -0.25%
Today Daily Open: 1.3072
Trends:
Daily SMA20: 1.2807
Daily SMA50: 1.2752
Daily SMA100: 1.2894
Daily SMA200: 1.3073
Levels:
Previous Daily High: 1.3081
Previous Daily Low: 1.2941
Previous Weekly High: 1.3002
Previous Weekly Low: 1.2668
Previous Monthly High: 1.284
Previous Monthly Low: 1.2477
Daily Fibonacci 38.2%: 1.3028
Daily Fibonacci 61.8%: 1.2995
Daily Pivot Point S1: 1.2982
Daily Pivot Point S2: 1.2891
Daily Pivot Point S3: 1.2842
Daily Pivot Point R1: 1.3122
Daily Pivot Point R2: 1.3172
Daily Pivot Point R3: 1.3262
