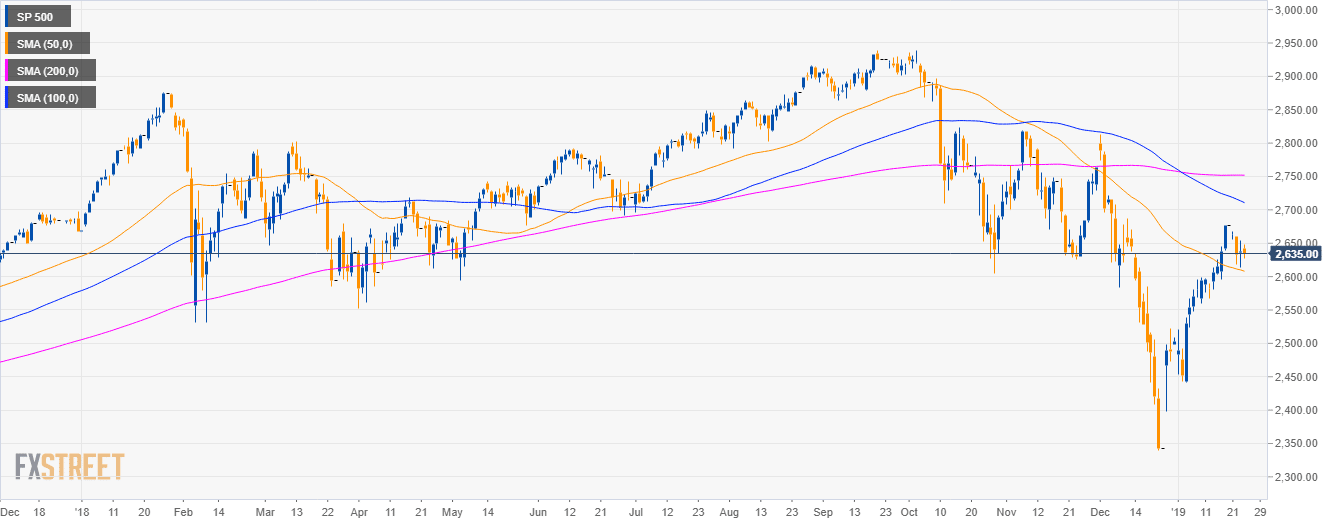
S&P500 daily chart
- The S&P500 Index is in a deep pullback below the 100 and 200-day simple moving averages (SMAs).
- The market is trading above the 50 SMA.
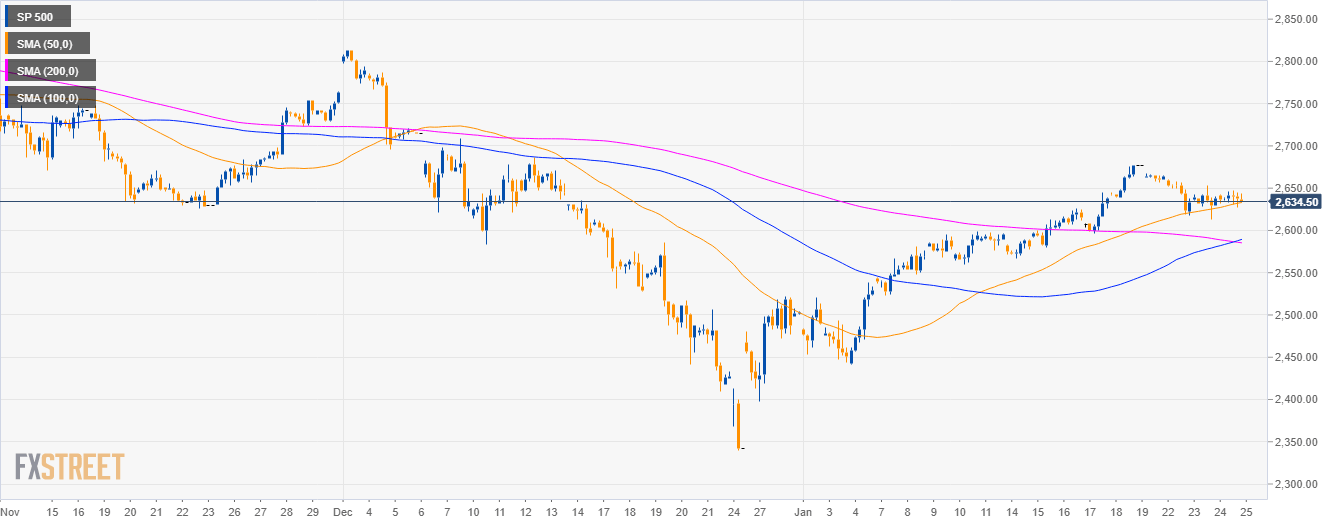
S&P500 4-hour chart
- The S&P500 is trading above the main SMAs suggesting bullish momentum in the medium-term.
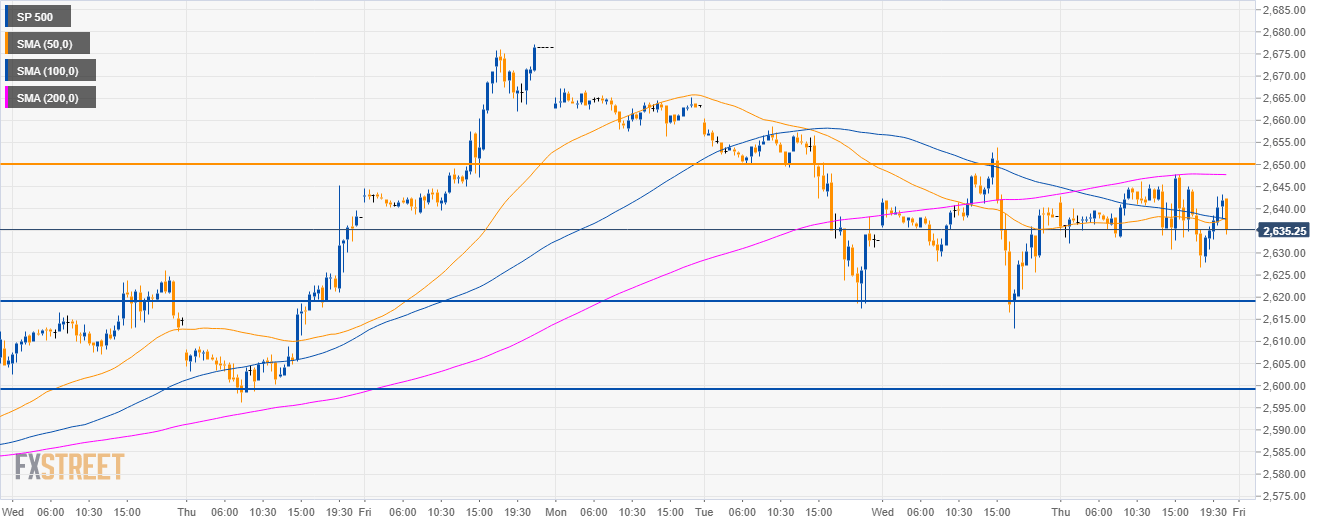
S&P500 30-minute chart
- The S&P500 is trading below the 2,650.00 level and the 200 SMA suggesting downward momentum in the near-term.
- A bearish break below the 2,620.00 support would lead to the 2,600.00 figure.
- To the upside, the 2,650.00 level is seen as resistance.
Additional key levels
SP 500
Overview:
Today Last Price: 2641.75
Today Daily change: 3.50 points
Today Daily change %: 0.13%
Today Daily Open: 2638.25
Trends:
Daily SMA20: 2578.57
Daily SMA50: 2610.04
Daily SMA100: 2713.42
Daily SMA200: 2752.04
Levels:
Previous Daily High: 2653.75
Previous Daily Low: 2613
Previous Weekly High: 2677.25
Previous Weekly Low: 2567.25
Previous Monthly High: 2813.5
Previous Monthly Low: 2340.25
Daily Fibonacci 38.2%: 2638.18
Daily Fibonacci 61.8%: 2628.57
Daily Pivot Point S1: 2616.25
Daily Pivot Point S2: 2594.25
Daily Pivot Point S3: 2575.5
Daily Pivot Point R1: 2657
Daily Pivot Point R2: 2675.75
Daily Pivot Point R3: 2697.75
