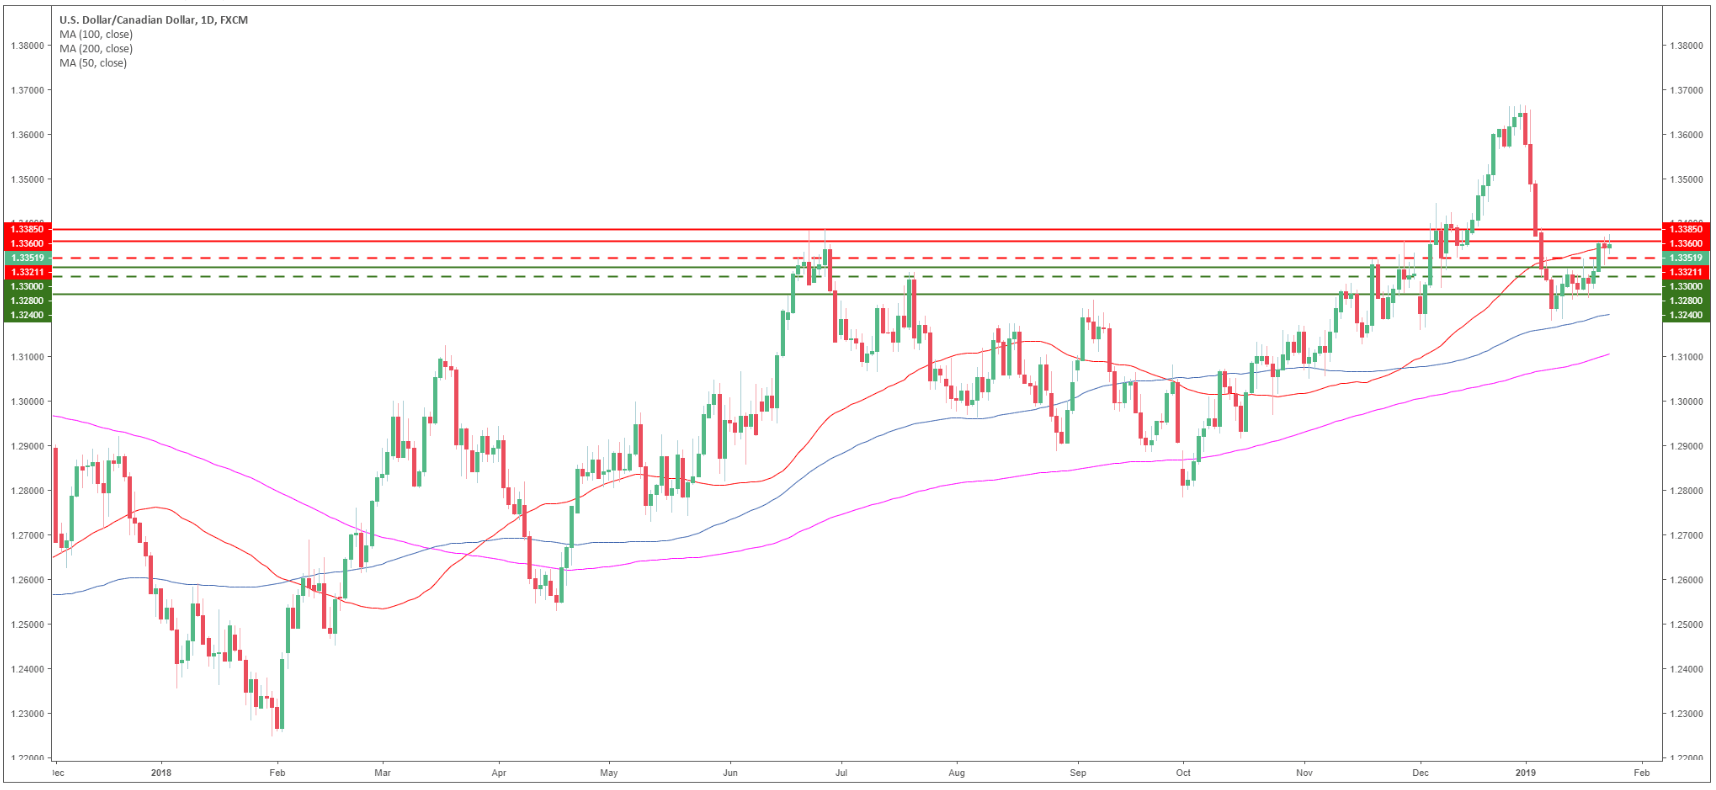
USD/CAD daily chart
- USD/CAD is in a bull trend above the 100 and 200-day simple moving averages (SMAs).
- The USD bulls are testing the 50 SMA.
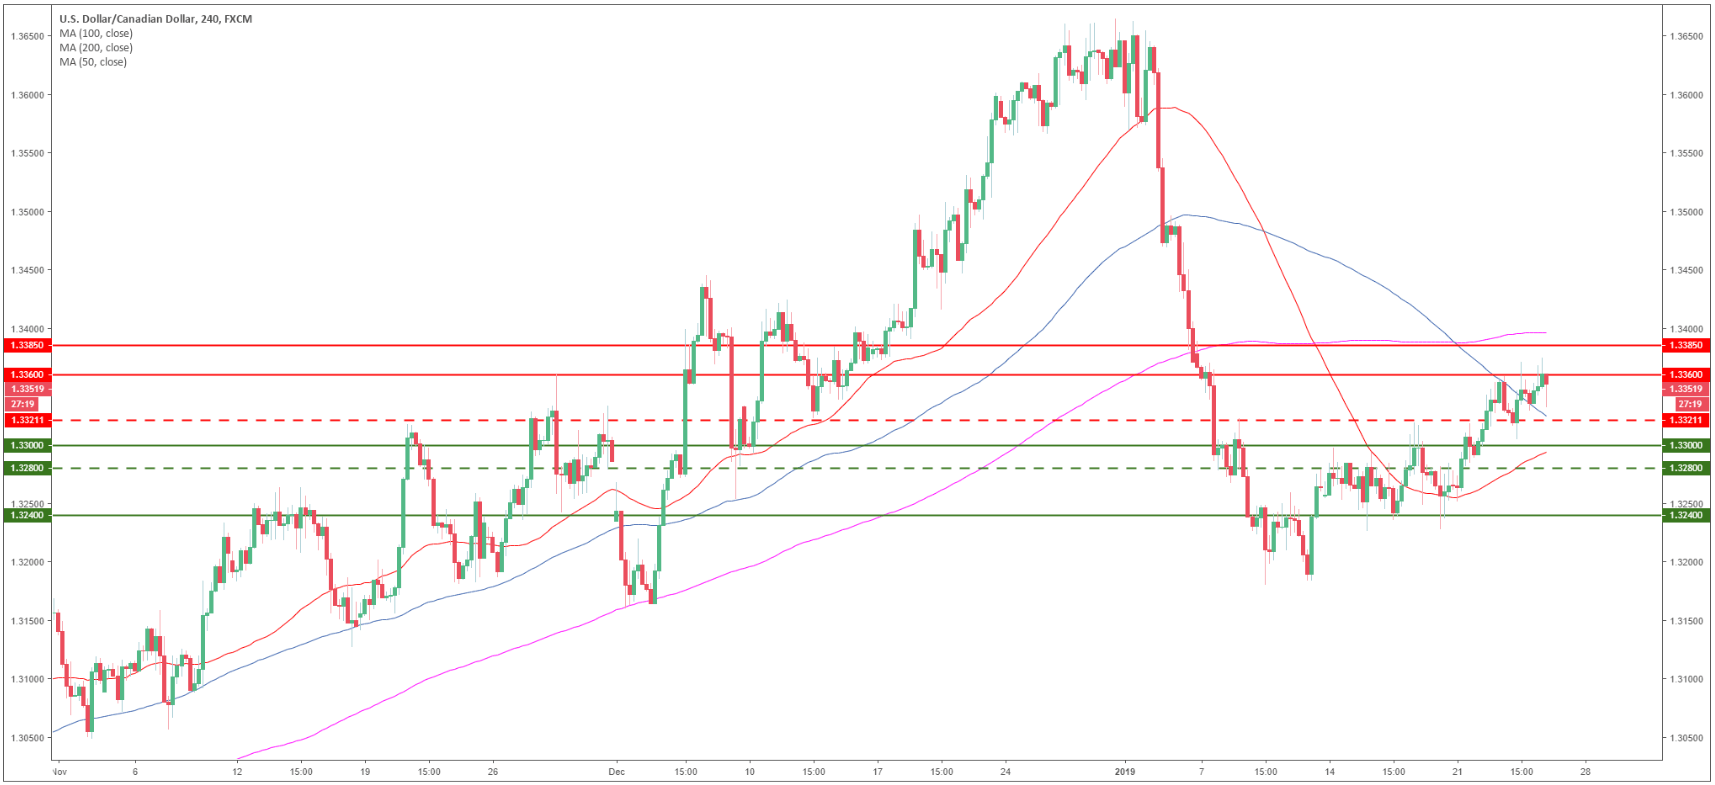
USD/CAD 4-hour chart
- USD/CAD is trading above the 1.3300 figure and the 50/100 SMA.
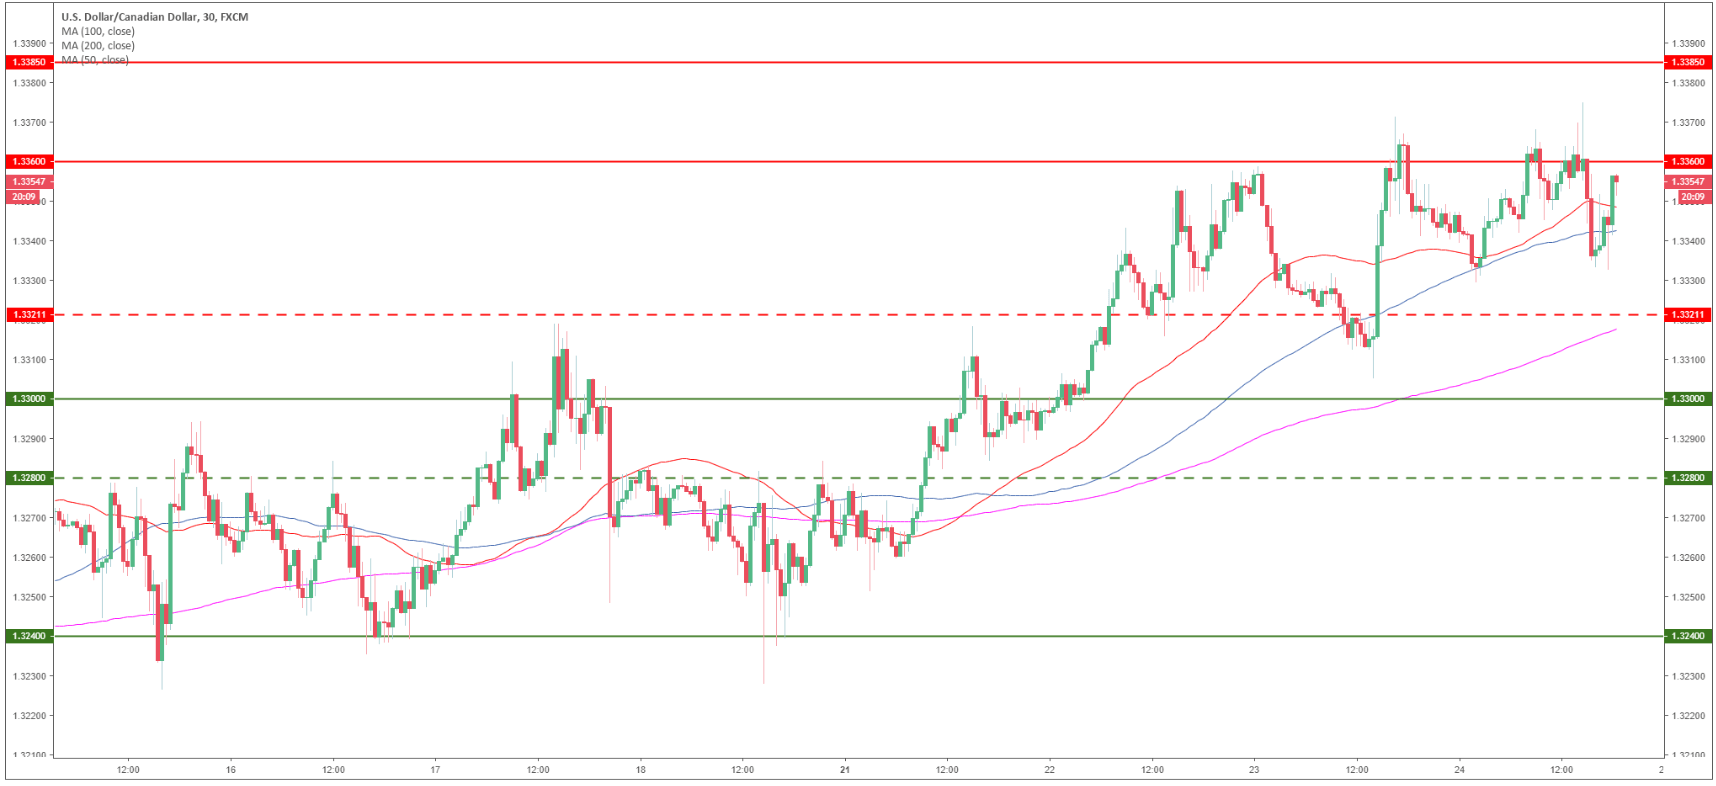
USD/CAD 30-minute chart
- USD/CAD is evolving above its main SMAs suggesting bullish momentum.
- Once again, USD bulls are looking at the 1.3360 resistance. They want a potential break above the level in order to travel to 1.3385 resistance.
- On the flip side, support is seen at 1.3320, 1.3000 and 1.3280.
Additional key levels
USD/CAD
Overview:
Today Last Price: 1.3356
Today Daily change: 12 pips
Today Daily change %: 0.09%
Today Daily Open: 1.3344
Trends:
Daily SMA20: 1.3384
Daily SMA50: 1.3374
Daily SMA100: 1.3209
Daily SMA200: 1.3112
Levels:
Previous Daily High: 1.3372
Previous Daily Low: 1.3304
Previous Weekly High: 1.332
Previous Weekly Low: 1.3226
Previous Monthly High: 1.4134
Previous Monthly Low: 1.316
Daily Fibonacci 38.2%: 1.333
Daily Fibonacci 61.8%: 1.3346
Daily Pivot Point S1: 1.3308
Daily Pivot Point S2: 1.3273
Daily Pivot Point S3: 1.3241
Daily Pivot Point R1: 1.3376
Daily Pivot Point R2: 1.3408
Daily Pivot Point R3: 1.3443
